Two tragedies, worlds apart, reached a boil last week and affected the financial markets in a not so pleasant way.
Greece, which is an ocean away and no stranger to tragedy, (think Aeschylus, Sophocles, and Euripides), nearly imploded last week on fears that its government was bankrupt. With huge budget deficits and no credible way to pay them, Greece saw its short-term government bond yields soar past 20%, according to Barron's. By contrast, the comparable bond in the U.S. yielded about 1% last week, according to the Treasury Department. As a euro country, Greece has limited tools to deal with the crisis on its own (e.g., it cannot devalue its currency or adjust its interest rates) so it has to rely on the kindness of neighbors to bail it out. This past weekend, the European Union and the International Monetary Fund announced that they will support Greece with a $146 billion multi-year aid package, according to Bloomberg. Now comes the hard part for Greece--implementing the austerity measures that accompany the bailout.
The concern that this debt problem could spread and undermine the euro countries helped undercut many world stock markets last week.
Closer to home, the uncapped oil leak in the Gulf of Mexico has states bordering the Gulf bracing for an environmental and economic disaster. The Gulf is a major oil-producing region and this spill could deter new drilling, a thought which helped send oil prices up more than 1% last week. Unfortunately, fishermen, the tourism industry, and the environment itself all stand to lose, too, as the spill worsens.
While the twin tragedies captured many of the headlines last week, much of the economic news was bullish. For example, first quarter gross domestic product grew at a respectable 3.2 percent annual rate, household spending increased at the fastest rate in three years, and The Institute for Supply Management-Chicago Inc. said its business barometer rose to 63.8 in April, the highest level in five years, according to Barron's. On top of that, The Economist magazine said, "global output is now back to where it was before the downturn…(and) there is growing optimism that the recovery is becoming self-sustaining."
Although the twin tragedies are still developing, recent solid economic news has helped limit their financial market impact.

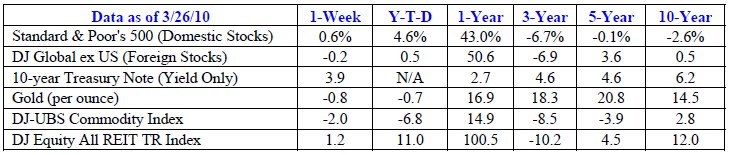
Sources: Yahoo! Finance, Barron’s, djindexes.com, London Bullion Market Association.
Past performance is no guarantee of future results. Indices are unmanaged and cannot be invested into directly. N/A means not applicable or not available.
"EVEN AFTER THE BIGGEST RALLY SINCE THE 1930s, U.S. stocks remain the cheapest in two decades as the economy improves," according to an April 26 Bloomberg story. How can that be? Well, digging into the numbers a bit, it appears the statement comes with some qualifiers. First, the "cheapness" is based on the price to earnings ratio (P/E) using forecasted earnings estimates. By that measure, the S&P 500 is trading at 14.1 times forecasted earnings. As you know, forecasts may or may not come true so, if earnings actually fall short of the projection, then today's P/E will be higher in retrospect.
Second, while the Bloomberg headline said stocks were the cheapest since 1990 based on analyst estimates, the article qualified that and said, "except for the months after Lehman Brothers Holdings Inc. collapsed." So, yes, stocks may be cheap now, but they have been cheaper in the recent past.
But wait, in the same article, Bloomberg points to another market valuation measure that says the market is significantly overvalued. Using the 10-year average corporate earnings model popularized by Yale economist Robert J. Shiller, the P/E on the S&P 500 is currently about 22, which is well above the historical average of 16.
Bulls will point to the P/E using forecasted earnings estimates and say stocks are cheap. Bears will point to the Shiller calculation and say stocks are not. Regardless of which view is ultimately correct, stay focused on your goals and your objectives for the future.
Best regards,
Kevin Kroskey
* The Standard & Poor's 500 (S&P 500) is an unmanaged group of securities considered to be representative of the stock market in general.
* The DJ Global ex US is an unmanaged group of non-U.S. securities designed to reflect the performance of the global equity securities that have readily available prices.
* The 10-year Treasury Note represents debt owed by the United States Treasury to the public. Since the U.S. Government is seen as a risk-free borrower, investors use the 10-year Treasury Note as a benchmark for the long-term bond market.
* Gold represents the London afternoon gold price fix as reported by the London Bullion Market Association.
* The DJ Commodity Index is designed to be a highly liquid and diversified benchmark for the commodity futures market. The Index is composed of futures contracts on 19 physical commodities and was launched on July 14, 1998.
* The DJ Equity All REIT TR Index measures the total return performance of the equity subcategory of the Real Estate Investment Trust (REIT) industry as calculated by Dow Jones.
* This newsletter was prepared by PEAK.
* Yahoo! Finance is the source for any reference to the performance of an index between two specific periods.
* Opinions expressed are subject to change without notice and are not intended as investment advice or to predict future performance.
* Past performance does not guarantee future results.
* You cannot invest directly in an index.
* Consult your financial professional before making any investment decision.