STOCK MARKET RISES SHARPLY
Thanks to a super strong September (the best in 71 years, according to CNBC), stocks rallied sharply for the quarter. It didn’t start off that well as Fed Chairman Ben Bernanke described the economic outlook as “unusually uncertain” in July. The stock market basically treaded water in July and August as it digested the second quarter’s big drop and the uncertain economic environment. By the time September rolled around, investors decided that the weak economy might actually be good news for the stock market. How? In the (il)logical way that the market sometimes works, investors began to believe that the economy was weak enough that the Fed would step in at some point with another round of quantitative easing. If that happened, interest rates might drop, the economy might get a lift, and stock prices might follow. That’s the theory, anyway, and investors followed it by bidding up stock prices.

ECONOMY STILL STUCK IN LOW GEAR
Normally, deep recessions are followed by strong growth. But, not this time. More than a year after the recession officially ended, we’re still stuck with a 9.6% unemployment rate and an economy that grew at a 1.7% annualized rate in the second quarter, down from 3.7% in the first quarter, according to The Wall Street Journal and Bloomberg.
On September 24, a concerned Ben Bernanke said, “A concerted policy effort has so far not produced an economic recovery of sufficient vigor to significantly reduce the high level of unemployment.” That was followed on September 30 by comments from New York Fed president William Dudley who said, “Further action is likely to be warranted unless the economic outlook evolves in a way that makes me more confident that we will see better outcomes for both employment and inflation before too long.” Together, these comments suggest to some market participants that the Fed is gearing up to dole out more goodies to reignite growth.
INTEREST RATES KEEP DROPPING
Investors still have a large appetite for bonds and the government and corporations stepped in to supply it “as new-debt issuance broke records and interest rates fell toward generational lows” in the third quarter, according to The Wall Street Journal. Like a coin, there are two sides to low interest rates.
On the plus side, low rates are a boon to corporations and banks as it lowers their borrowing costs and encourages them to reinvest in their businesses. It also helps the government because it lowers their borrowing costs.
On the negative side, savers get pinched. According to Dan Dekta, chief investment officer at Smith Breeden Associates, “The Fed has effectively been taxing money-market funds [by cutting short-term interest rates] to recapitalize the financial system and to make things easier on borrowers.” So, if you’re a saver, you get near zip on your savings while borrowers reap the savings.
THE DOLLAR DILEMMA
“The dollar seems to be the ugliest girl at the dance,” according to Lane Newman, director of foreign exchange at ING Groep NV in New York as quoted in Bloomberg. With the U.S. economy still relatively weak, investors are losing enthusiasm for the dollar because they fear the Fed will drive down interest rates even further. Low interest rates make the dollar less attractive relative to other countries that may offer higher rates. This concern helped drive the dollar to a third quarter loss that was its worst quarterly loss in eight years, according to MarketWatch.
A weak dollar does benefit U.S. exporters because it makes our products less expensive to foreign consumers. A strong export economy could help lower our unemployment rate and that’s one reason why our government is not too concerned about a weak dollar. Here’s the catch, though. Other countries may want a cheap currency, too, so they can revive their own exports. Since the value of a currency is only measured in relation to another currency (or a precious metal like gold), if too many countries try to devalue their currency, then it becomes a “race to the bottom.” In that scenario, it’s likely nobody will win.
And, speaking of gold, it hit record highs in the third quarter. John Roque of WJB Capital was quoted in Barron’s as saying, “all the price of gold tells you is what paper money isn't worth.” And, as gold keeps going higher, that suggests people are getting less and less comfortable with the value of paper money.
SUMMARY
The big rally in the third quarter was preceded by a big drop in the second quarter. Net, net, after nine months, the S&P 500 index is up 2.3% for the year. Despite a lot of huffing and puffing, we’re still just about where we started the year.
Weekly Focus – Think About It
“Live as if you were to die tomorrow. Learn as if you were to live forever.” --Mahatma Gandhi
Best regards,
Kevin Kroskey
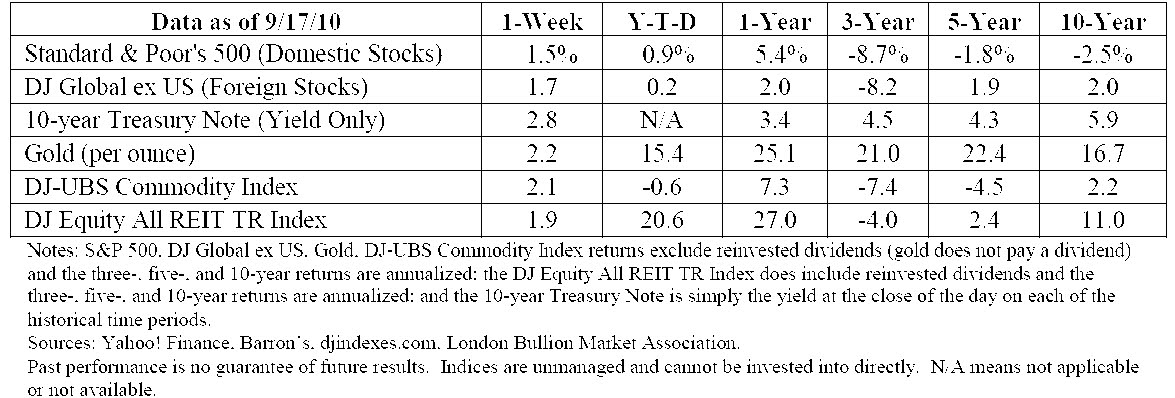
* The Standard & Poor's 500 (S&P 500) is an unmanaged group of securities considered to be representative of the stock market in general.
* The DJ Global ex US is an unmanaged group of non-U.S. securities designed to reflect the performance of the global equity securities that have readily available prices.
* The 10-year Treasury Note represents debt owed by the United States Treasury to the public. Since the U.S. Government is seen as a risk-free borrower, investors use the 10-year Treasury Note as a benchmark for the long-term bond market.
* Gold represents the London afternoon gold price fix as reported by the London Bullion Market Association.
* The DJ Commodity Index is designed to be a highly liquid and diversified benchmark for the commodity futures market. The Index is composed of futures contracts on 19 physical commodities and was launched on July 14, 1998.
* The DJ Equity All REIT TR Index measures the total return performance of the equity subcategory of the Real Estate Investment Trust (REIT) industry as calculated by Dow Jones.
* Yahoo! Finance is the source for any reference to the performance of an index between two specific periods.
* Opinions expressed are subject to change without notice and are not intended as investment advice or to predict future performance.
* Past performance does not guarantee future results.
* You cannot invest directly in an index.
* Consult your financial professional before making any investment decision.
* This newsletter was prepared by PEAK.