2015 First Quarter Report

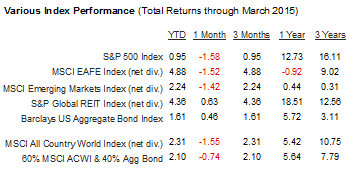
The first quarter of the new year has brought us small positive returns in many of the U.S. and global indices and more than the usual amount of anxiety along with them. See below for common market benchmark performance.
 
 
If you were watching the markets day to day, you experienced a mild roller coaster, what trading professionals refer to as a sideways market.  One day it was up, the next down, each day (or week) seeming to erase the gains or losses of the previous ones.  The best explanation for this phenomenon is that investors are still looking over their shoulders at interest rates, waiting for bond yields to jump higher, making bonds more competitive with stocks and triggering an outflow from the stock market that could (so the reasoning goes) cause a bear market in U.S. equities. 
 
However, investors have been waiting for this shoe to drop for the better part of three years, and meanwhile, interest rates have drifted decidedly lower in the first quarter.  The Bloomberg U.S. Corporate Bond Index now has an effective yield of 2.93%.  30-year Treasuries are yielding 2.48%, roughly 0.3% lower than in December, and 10-year Treasuries currently yield 1.87%, down from 2.17% at the beginning of the year. 
 
This interest rate watch has created a peculiar dynamic where up is down and down is up in terms of how traders and stock market gamblers look at the future.  The generally positive economic news is greeted with dismay (The Fed will notice and start raising rates sooner rather than later!  Boo!) and any bad news sends the stock market back up again into mild euphoria (The Fed might hold off another quarter!  Yay!). 
 
The Fed’s future actions are inscrutable.  You will hear knowledgeable Fed-watchers say that the Fed will take action as early as June or as late as next year, and none of them really know.
 
We should all welcome the Fed pullback, not fear it.  A lot of the uncertainty among traders and even long-term investors is coming from anxiety over how this experiment is going to end.  The U.S. Central bank has directly intervened in the markets and in the economy, and is still doing so.  When that ends, normal market forces will take over, and we’ll all have a better handle on what “normal” means in this economic era.  Is there great demand for credit to fuel growth?  What would rational investors pay for Treasury and corporate bonds if they weren’t bidding against an 800-pound gorilla?  Would retirees prefer an absolutely certain 4.5% return on 30-year Treasury bonds or the less certain (but historically higher) returns they can get from the stock market?  These are questions that all of us would like to know the answer to, and we won’t until all the QE interventions have ended.
 
What DO we know?  Data shows that the U.S. economy is less dependent on foreign oil than at any time since 1987, and the trend is moving toward complete independence.  Oil—and energy generally—is cheaper now than it has been in several decades, which makes our lives, and the production of goods and services, less expensive.
 
Meanwhile, more Americans are working.  Figure 3 shows that the U.S. unemployment rate—at 5.5%—is trending dramatically lower and is now reaching levels that are actually below the long-term norms.  Unemployment today is lower than the rate for much of the booming ‘90s, and is approaching the lows of the early 1970s. 
 
And real GDP—the broadest measure of economic activity in the United States—increased 2.4% last year, after rising 2.2% the previous year.   America is growing.  Not rapidly, but slow growth might not be so terrible.  Rapid economic growth has, in the past, often preceded economic recessions, where excesses had to be corrected.  Slow, steady growth may be boring, but it’s certainly not bad news for the economy or the markets.
 
It has been said that people lose far more money in opportunity costs by trying to avoid future market downturns while the markets are still going up than by holding their ground during actual downturns.  And, in fact, in every case so far, the U.S. market has eventually made up the ground it lost in every bear market we’ve experienced.  The last trading day of the quarter looked bearish, as have many other gloomy trading days during this seven year bull market.  It seems like every week, somebody else has predicted an imminent decline that has not happened.  People who listened to the alarmists lost out on solid returns.  You filter out the good news at your peril.

To Your Prosperity,

Kevin Kroskey, CFP®, MBA
  
This article adapted with permission from Bob Veres.
Sources:
Wilshire index data: http://www.wilshire.com/Indexes/calculator/
Russell index data: http://www.russell.com/indexes/data/daily_total_returns_us.asp
S&P index data: http://www.standardandpoors.com/indices/sp-500/en/us/?indexId=spusa-500-usduf--p-us-l--
http://www.tradingeconomics.com/united-states/unemployment-rate
Nasdaq index data: http://quicktake.morningstar.com/Index/IndexCharts.aspx?Symbol=COMP
International indices: http://www.mscibarra.com/products/indices/international_equity_indices/performance.html
Commodities index data: http://us.spindices.com/index-family/commodities/sp-gsci
Treasury market rates: http://www.bloomberg.com/markets/rates-bonds/government-bonds/us/
http://www.bloomberg.com/news/articles/2015-04-01/u-s-oil-imports-from-opec-have-plunged-to-a-28-year-low
Aggregate corporate bond rates: https://indices.barcap.com/show?url=Benchmark_Indices/Aggregate/Bond_Indices
Aggregate corporate bond rates: http://www.bloomberg.com/markets/rates-bonds/corporate-bonds/
http://bea.gov/newsreleases/national/gdp/gdpnewsrelease.htm

February Monthly Market Commentary

THE MONTH IN BRIEF
What a difference a month makes. After a rough January, the S&P 500 soared 5.49% in February. Steadying oil prices, solid earnings, improving indicators in Europe and Asia and central bank action all prompted the bulls to run freely. Stateside, inflation gave way to a touch of deflation, home sales cooled off and consumer spending and confidence were disappointing – but the labor market was in good shape and so were the manufacturing and service sectors. February brought some reassuring economic news, and that was all Wall Street needed for a rally.1


DOMESTIC ECONOMIC HEALTH
Cheaper fuel and energy costs meant two things: less consumer spending and falling consumer prices. Important economic indicators reflected these developments. January’s Consumer Price Index dipped 0.7% (although the core CPI rose 0.2%), resulting in annual deflation in the United States for the first time since October 2009. Personal spending lagged 0.2% during January. The federal government also reduced Q4 GDP in its second estimate, taking growth down to 2.3% from the previously announced 2.6%.2,3
 
Consumer confidence retreated, perhaps in the wake of a bad January for stocks and word that gas prices were poised to go back up. February’s Conference Board index slipped 7.4 points to 96.4; the final February University of Michigan consumer sentiment index came in at 95.4, down from 98.1 in the final January survey.2,4
   
Fortunately, there was enough good news to offset the bad. The Labor Department’s January jobs report showed 257,000 new hires. Companies were hiring at the fastest clip in 18 years – non-farm payrolls had swelled by an average of 336,000 workers a month from November-January. The unemployment rate did tick north to 5.7% in January and the underemployment (U-6) rate was up at 11.3%, but this reflected an increase in job seekers. Hourly wages were up 0.5% in January, personal incomes up 0.3%.2,5
   
America’s manufacturing sector continued to grow and expand. February’s ISM factory PMI came in at 52.9, not too far off of January’s 53.5 reading; the Federal Reserve found manufacturing output up 0.2% for that month. ISM’s service sector PMI had notched a reading of 56.7 for January, rising 0.2 points. Hard goods orders improved 2.8% in January after slipping 3.7% in December. The Producer Price Index declined 0.8% in January thanks largely to a record 10.3% monthly plunge for wholesale energy prices (January saw a seventh consecutive monthly decline).2,6
          
Fed chair Janet Yellen underlined the central bank’s commitment to patience on raising interest rates in her February testimony before the Senate banking committee, saying it seemed “unlikely that economic conditions will warrant an increase in the target range for the federal funds rate for at least the next couple of FOMC meetings.”7    
          
GLOBAL ECONOMIC HEALTH
There was no “Grexit” in February: Greece and the European Union hammered out a deal in principle to extend aid to that nation’s beleaguered economy through the end of June. (Without a deal, the €240 billion bailout for Greece would have ceased at the end of February). Greece remained on shaky ground with the EU and the International Monetary Fund, but at least it remained in the eurozone. A Eurostat flash estimate showed euro area deflation halved in February from January levels (consumer prices retreated only 0.3% annually as opposed to 0.6%). Unemployment ticked down to 11.2% in the 19-country euro area in January, a 33-month low.8,9
      
February ended with a surprise from the east: the People’s Bank of China made its second interest rate cut in three months (the benchmark rate was lowered 0.25% to 5.35%). Also, the final February HSBC/Markit China manufacturing PMI showed sector growth again at a better-than-expected 50.7 reading, up a full point in a month. February HSBC/Markit factory PMIs in other key Asia Pacific nations were all above 50 as well: 52.9 in India, 51.6 in Japan, and 51.1 in South Korea.10,11

WORLD MARKETS        
Just how good was February for stocks? You not only had all-time highs for the S&P and Dow by the end of the month, you also had historic peaks for Germany’s DAX and Great Britain’s FTSE 100 and Japan’s Nikkei 225 reaching a 15-year high.12
          
COMMODITIES MARKETS
Oil found a floor and took a step up: on the NYMEX, light sweet crude ended the month at $49.76 a barrel, going +3.32% for February. The big leap was taken by RBOB gasoline, which rose 24.43% on the month. February also saw gains of 14.74% for heating oil and 1.05% for natural gas. Cocoa futures were up 15.59% for February, corn futures 3.58%, cotton futures 7.87%, soybean futures 7.24% and wheat futures 3.59%. Last month’s losers among ag futures included coffee (-15.10%) and sugar (-5.81%).14
 
Gold retreated 4.70% to $1,213.10, silver 2.56% to $16.56. Platinum fell 3.60%. As for the U.S. Dollar Index, it wrapped up February at 95.29 (+0.52% on the month).14,15
    
REAL ESTATE
Brutal weather across two-thirds of the country held homebuying back. The Census Bureau found new home sales tailing off 0.2% in January. More significantly, the National Association of Realtors measured a 4.9% fall in existing home sales. The NAR did announce a 1.7% January gain in its pending home sales index. According to the latest S&P/Case-Shiller home price index, prices across 20 major metro areas climbed an average of 4.5% during 2014.2,16
  
Snow, sleet and ice had also slightly hindered new construction. The Census Bureau reported groundbreaking down 2.0% for January, and there were also 0.7% fewer building permits issued. Starts were still up 18.7% from a year prior, and permits were 8.1% above year-ago levels.17
   
Home loan interest rates increased in February. Freddie Mac’s February 26 Primary Mortgage Market Survey found the average interest on a 30-year FRM at 3.80%, a 15-year FRM at 3.07%, a 5/1-year ARM at 2.99% and a 1-year ARM at 2.44%. In its January 29 survey, interest averaged 3.66% for the 30-year fixed, 2.98% for the 15-year fixed, 2.86% for the 5/1-year ARM and 2.38% for the 1-year ARM.18
         
LOOKING BACK…LOOKING FORWARD
February brought a major drop for the CBOE VIX; the so-called “fear index” ended the month 36.39% lower at 13.34. The Nasdaq climbed 7.08% to 4,963.53, the Russell 2000 5.83% to 1,233.37, the Dow 5.64% to 18,132.70 and the S&P 5.49% to 2,104.50. February, in fact, was the S&P’s hottest month since October 2011.1,12
 

March opened with the Nasdaq closing above 5,000 for only the third time in history and the S&P, Russell 2000 and Dow all settling at record levels. Have headwinds suddenly ceased? No. In Europe, the restructured Greek debt deal is still a shaky one, deflation is lingering and the jobless rate is twice ours. Demand for key commodities isn’t where it was two years ago; oil prices are half what they once were. Warnings that the majority of stocks are overvalued continue, with bears maintaining that the S&P will only make a minor gain for 2015. Still, the bulls staged a remarkable return last month and March has begun with the sense that obstacles have been cleared from their path. While this bull market is growing venerable, it does not yet seem vulnerable to many investors.22

To Your Prosperity,
 
Kevin Kroskey, CFP®, MBA
 
This article adapted with permission from MarketingLibrary.net.
Citations.
1 - wsj.com/mdc/public/page/2_3023-monthly_gblstkidx.html [2/27/15]
2 - marketwatch.com/economy-politics/calendars/economic [2/27/15]
3 - tinyurl.com/pn4rvqe [2/26/15]
4 - investing.com/economic-calendar/michigan-consumer-sentiment-320 [2/27/15]
5 - marketwatch.com/story/us-adds-257000-jobs-as-wage-gains-appear-2015-02-06 [2/6/15]
6 - reuters.com/article/2015/02/18/usa-economy-idUSL1N0VS0SI20150218 [2/18/15]
7 - tinyurl.com/omzlqpe [2/24/15]
8 - irishtimes.com/business/economy/greece-eurogroup-agree-to-four-month-bailout-extension-1.2111060 [2/20/15]
9 - ec.europa.eu/eurostat [3/2/15]
10 - moneycontrol.com/news/asian-markets/chinas-rate-cut-buoys-asia-stks-yuan-at-over-two-year-low_1317789.html [3/2/15]
11 - tinyurl.com/n7sqltg [3/2/15]
12 - money.cnn.com/2015/02/27/investing/stocks-market-record-february/index.html [2/27/15]
13 - mscibarra.com/products/indices/international_equity_indices/gimi/stdindex/performance.html [2/27/15]
14 - money.cnn.com/data/commodities/ [2/27/15]
15 - online.wsj.com/mdc/public/npage/2_3050.html?mod=mdc_curr_dtabnk&symb=DXY [3/2/15]
16 - usnews.com/news/business/articles/2015/02/25/us-new-home-sales-barely-nudge-up-in-january [2/25/15]
17 - equipmentworld.com/u-s-home-starts-fall-2-percent-in-january-as-builder-confidence-dips-due-to-cold-weather/ [2/18/15]
18 - freddiemac.com/pmms/archive.html [3/2/15]
19 - bigcharts.marketwatch.com/historical/default.asp?symb=DJIA&closeDate=2%2F27%2F14&x=0&y=0 [2/27/15]
19 - bigcharts.marketwatch.com/historical/default.asp?symb=COMP&closeDate=2%2F27%2F14&x=0&y=0 [2/27/15]
19 - bigcharts.marketwatch.com/historical/default.asp?symb=SPX&closeDate=2%2F27%2F14&x=0&y=0 [2/27/15]
19 - bigcharts.marketwatch.com/historical/default.asp?symb=DJIA&closeDate=2%2F26%2F10&x=0&y=0 [2/27/15]
19 - bigcharts.marketwatch.com/historical/default.asp?symb=COMP&closeDate=2%2F26%2F10&x=0&y=0 [2/27/15]
19 - bigcharts.marketwatch.com/historical/default.asp?symb=SPX&closeDate=2%2F26%2F10&x=0&y=0 [2/27/15]
19 - bigcharts.marketwatch.com/historical/default.asp?symb=DJIA&closeDate=2%2F28%2F05&x=0&y=0 [2/27/15]
19 - bigcharts.marketwatch.com/historical/default.asp?symb=COMP&closeDate=2%2F28%2F05&x=0&y=0 [2/27/15]
19 - bigcharts.marketwatch.com/historical/default.asp?symb=SPX&closeDate=2%2F28%2F05&x=0&y=0 [2/27/15]        
20 - treasury.gov/resource-center/data-chart-center/interest-rates/Pages/TextView.aspx?data=realyield [3/2/15]
21 - treasury.gov/resource-center/data-chart-center/interest-rates/Pages/TextView.aspx?data=realyieldAll [3/2/15]
22 - marketwatch.com/story/us-stocks-futures-climb-ahead-of-data-deluge-2015-03-02/ [3/2/15]
 

January Monthly Market Commentary

THE MONTH IN BRIEF
Assumptions of a global slowdown sent stocks further down in January. The blue chips and the small caps both fell more than 3% on the month. Gold and the dollar got off to a hot start for 2015, as did many foreign stock markets; energy and crop futures mostly extended losing streaks. Housing indicators were mixed, and the latest data on consumer spending, inflation and retail sales raised some questions. The big economic news came from overseas as the European Central Bank announced a long-awaited easing effort; stateside, the Federal Reserve seemed to hint that it was still considering raising interest rates this year.1


Key index performance is shown in the table below.
 
 
DOMESTIC ECONOMIC HEALTH
If institutional investors had felt as confident as American households last month, stocks might have performed better. January saw the Conference Board’s consumer confidence index reach an impressive 102.9, and the University of Michigan’s consumer sentiment index ended the month at 98.1.2
 
While consumer confidence was rising, consumer spending abruptly tailed off. Commerce Department data showed it retreating 0.3% in December. Retail sales also dropped 0.9% in the same month after two months of
solid gains.2,3
 
On the upside, personal wages grew 0.3% in December, and the federal government announced that Q4 personal spending had advanced 4.3%, becoming the major factor in the 2.6% initial estimate of Q4 GDP released in late January.2,4
 
The latest Labor Department report showed more improvement. December saw the jobless rate dip another 0.2% to 5.6%; the overall U-6 rate, which measures the marginally employed as well as the unemployed, also decreased to 11.2%. Thanks to 252,000 more Americans finding employment in December, 2014 became the nation’s best year for hiring since 2000.5 
 
Looking at another key economic barometer, we see remarkably little inflation pressure stateside. The Consumer Price Index dipped 0.4% in December following a 0.3% retreat in November. That meant the country experienced just 0.8% inflation for 2014. The core CPI was flat in December, so its year-over-year change was 1.6%. As for the Producer Price Index, it pulled back 0.3% for December and rose just 1.1% for 2014; the core PPI rose 0.3% for December, taking its 2014 gain to 2.1%.3
 
In the face of this mixed bag of indicators, the Fed sounded pretty bullish. Its latest policy statement (January 28) noted the economy expanding “at a solid pace” as opposed to the “moderate pace” noted in prior Federal Open Market Committee reflections. Nothing in the statement gave off impressions that the Fed would delay a rate hike until 2016.6     
 
GLOBAL ECONOMIC HEALTH
In late January, the European Central Bank unveiled a money-purchase program of proportions to rival QE3. The ECB announced it would buy €60 billion in bonds each month through September 2016. By weakening the euro, the central bank is aiding the economies of most eurozone countries, which are pegged heavily to exports.7
 
The ECB had to do something; annualized eurozone inflation reached -0.2% in December, the European Commission forecasts it at -0.6% for January, and it is projected to stay at +0.5% or less through 2020. For 2015, the eurozone economy is expected to expand only 1.2%; the euro area jobless rate was 11.4% in December, and that was a 2-year low.7,8
 
Did China’s economy rev up a bit in January? No. January’s “official” China factory PMI dipped 0.3 points to 49.8 (meaning contraction) and its “official” service sector PMI dropped 0.4 points to 53.7. The HSBC/Markit China PMI stayed below 50 for another month (49.7). South Korea’s key manufacturing PMI had improved 1.5 points to 51.1 in December, and Indonesia’s rose 0.9 points to 48.5; India’s factory PMI fell 1.6 points to 52.9.9
 
COMMODITIES MARKETS
Gold had a tremendous month, with futures rising 8.38% on the COMEX to settle at $1,279.20 on January 30. Its ascent was mirrored by a 9.24% climb for silver, with an ounce of that commodity being worth $17.21 at January’s end. Platinum rose 2.38% on the month; copper dropped 10.91%. The U.S. Dollar Index surged north another 5.02% in January to end the month at 94.80.11,12
 
Apart from the greenback and precious metals, the commodities sector didn’t really offer much to cheer about. Light sweet crude fell further in New York: a barrel was worth just $48.24 on the NYMEX when the month ended. January also saw heating oil futures sink another 7.43% and natural gas futures give up another 8.20%. Crops mostly descended as well, with cotton losing 1.51%, coffee 3.80%, cocoa 8.12%, soybeans 5.79%, corn 7.23% and wheat 15.27%. It wasn’t all bad, as unleaded gasoline did rise 0.61% and sugar gained 1.79%.11
 
REAL ESTATE
Mortgages got even cheaper last month: the interest rate for the 30-year fixed averaged only 3.66% according to the January 29 Freddie Mac Primary Mortgage Market Survey. That was down from 3.87% on December 31. Between the two surveys, average interest rates on the key mortgage types declined as follows: 15-year FRM, 3.15% to 2.98%; 5/1-year ARM, 3.01% to 2.86%; 1-year ARM, 2.40% to 2.38%.13,14
 
New home sales soared in December: they were up 11.6% according to the Census Bureau, coming off a (revised) 6.7% drop in November. Existing home sales improved slightly in December as well – the National Association of Realtors found them rising 2.4%, much better than the (revised) 6.3% fall of a month before. NAR’s pending home sales index, on the other hand, fell 3.7% for December after a November gain of 0.6%.2,3
 
As for home prices, NAR said that the national median resale price was $208,500 in December – the best median price in six years, and up 5.8% from a year earlier. That year-over-year improvement surpassed the 4.3% gain in the 20-city Case-Shiller home price index for December.2,15
 
To Your Prosperity,
 
Kevin Kroskey, CFP®, MBA


This article adapted with permission from MarketingLibrary.net.
 
Citations.
1 - online.wsj.com/mdc/public/page/2_3023-monthly_gblstkidx.html [1/31/15]
2 - marketwatch.com/economy-politics/calendars/economic [2/2/15]
3 - investing.com/economic-calendar/ [2/2/15]
4 - latimes.com/business/la-fi-gdp-fourth-quarter-economy-20150130-story.html [1/30/15]
5 - haver.com/comment/comment.html?c=150109B.html [1/9/15]
6 - reuters.com/article/2015/01/28/us-usa-fed-idUSKBN0L10DZ20150128 [1/28/15]
7 - latimes.com/business/la-fi-ecb-stimulus-euro-quantitative-easing-20150122-story.html [1/22/15]
8 - ec.europa.eu/eurostat [2/2/15]
9 - blogs.wsj.com/moneybeat/2015/02/02/macro-horizons-china-manufacturing-contraction-has-global-ramifications/ [2/2/15]
10 - mscibarra.com/products/indices/international_equity_indices/gimi/stdindex/performance.html [12/31/15]
11 - money.cnn.com/data/commodities/ [1/31/15]
12 - online.wsj.com/mdc/public/npage/2_3050.html?mod=mdc_curr_dtabnk&symb=DXY [1/31/15]
13 - freddiemac.com/pmms/archive.html [2/2/15]
14 - freddiemac.com/pmms/archive.html?year=2014 [2/2/15]
15 - consumeraffairs.com/news/a-strong-finish-for-sales-of-existing-homes-012315.html [1/23/15]
16 - dailyfinance.com/2015/01/21/new-home-construction-rises-december/ [1/21/15]
17 - bigcharts.marketwatch.com/historical/default.asp?symb=DJIA&closeDate=1%2F29%2F10&x=0&y=0 [1/30/15]
17 - bigcharts.marketwatch.com/historical/default.asp?symb=COMP&closeDate=1%2F29%2F10&x=0&y=0 [1/30/15]
17 - bigcharts.marketwatch.com/historical/default.asp?symb=SPX&closeDate=1%2F29%2F10&x=0&y=0 [1/30/15]
17 - bigcharts.marketwatch.com/historical/default.asp?symb=DJIA&closeDate=1%2F31%2F05&x=0&y=0 [1/30/15]
17 - bigcharts.marketwatch.com/historical/default.asp?symb=COMP&closeDate=1%2F31%2F05&x=0&y=0 [1/30/15]
17 - bigcharts.marketwatch.com/historical/default.asp?symb=SPX&closeDate=1%2F31%2F05&x=0&y=0 [1/30/15]        
18 - treasury.gov/resource-center/data-chart-center/interest-rates/Pages/TextView.aspx?data=realyieldAll [2/2/15]
19 - treasury.gov/resource-center/data-chart-center/interest-rates/Pages/TextView.aspx?data=realyieldAll [1/30/15]
20 - marketwatch.com/story/stock-markets-fate-depends-on-the-next-six-days-2015-01-23 [1/23/15]
21 - online.wsj.com/mdc/public/page/2_3023-monthly_gblstkidx.html [12/31/14]
 

2014 Year In Investing

Looking back on 2014, people are going to say it was a great year to be an investor. They won’t remember how uncertain the journey felt right up to the last day of a year that saw the S&P 500 close at a record level on 53 different days. Think back over a good year in the market. Was there ever a time when you felt confidently bullish that the markets were taking off and delivering double-digit returns?

Key index performance is shown in the table below. 


Part of the reason that U.S. stocks performed so well when investors seemed to be constantly looking over their shoulders is interest rates—specifically, the fact that interest rates remained stubbornly low, aided, in no small part, by a Federal Reserve that seems determined not to let the markets dictate bond yields until the economy is firmly and definitively on its feet. The Bloomberg U.S. Corporate Bond Index now has an effective yield of 3.13%, giving its investors a windfall return of 7.27% for the year due to falling bond rates. 30-year Treasuries are yielding 2.75%, and 10-year Treasuries currently yield 2.17%. At the low end, 3-month T-bills are still yielding a miniscule 0.04%; 6-month bills are only slightly more generous, at 0.12%.

Normally when the U.S. investment markets have posted six consecutive years of gains, five of them in double-digit territory, you would expect to see a kind of euphoria sweep through the ranks of investors. But for most of 2014, investors in aggregate seemed to vacillate between caution and fear, hanging on every economic and jobs report, paying close attention to the Federal Reserve Board’s pronouncements, seemingly trying to find the bad news in the long, steady economic recovery.

One of the most interesting aspects of 2014—and, indeed, the entire U.S. bull market period since 2009—is that so many people think portfolio diversification was a bad thing for their wealth. When global stocks are down compared with the U.S. markets, U.S. investors tend to look at their statements and wonder why they’re lagging the S&P index that they see on the nightly news. This year, commodity-related investments were also down significantly, producing even more drag during what was otherwise a good investment year.

But that’s the point of diversification: when the year began, none of us knew whether the U.S., Europe, both or neither would finish the year in positive territory. Holding some of each is a prudent strategy, yet the eye inevitably turns to the declining investment which, in hindsight, pulled the overall returns down a bit. At the end of next year, we may be looking at U.S. stocks with the same gimlet eye and feeling grateful that we were invested in global stocks as a way to contain the damage; there’s no way to know in advance.

Is a decline in U.S. stocks likely? One can never predict these things in advance, but the usual recipe for a terrible market year is a period right beforehand when investors finally throw caution to the winds, and those who never joined the bull market run decide it’s time to crash the party. The markets have a habit of punishing overconfidence, but we don’t seem to be seeing that quite yet.  However, been many valuation metrics, US stocks seem expensive.

What we ARE seeing is kind of boring: a long, slow economic recovery in the U.S., a slow housing recovery, healthy but not spectacular job creation in the U.S., stagnation and fears of another Greek default in Europe, stocks trading at values slightly higher than historical norms and a Fed policy that seems to be waiting for certainty or a Sign from Above that the recovery will survive a return to normal interest rates. 

On the plus side for consumers, we also saw a 46% decline in crude oil prices, saving U.S. drivers approximately $14 billion this year.

The Fed has signaled that it plans to take its foot off of interest rates sometime in the middle of next year. The questions that nobody can answer are important ones: Will the recovery gain steam and perhaps help companies increase earnings growth to help justify lofty valuations in the year ahead? Will Europe stabilize and ultimately recover, raising the value of European stocks? Will oil prices remain low, giving a continuing boost to portions the economy? Or will, contrary to long history, the markets flop without any kind of a euphoric top?

We can’t answer any of these questions, of course. What we do know is that since 1958, the U.S. markets, as measured by the S&P 500 index, have been up 53% of all trading days, 58% of all months, 63% of all quarters and 72% of the years. Over 10-year rolling time periods, the markets have been up 88% of the time. These figures do not include the value of the dividends that investors were paid for hanging onto their stock investments during each of the time periods.

Yet since 1875, the S&P 500 has never risen for seven calendar years in a row. Could 2015 break that streak? Stay tuned.
 
To Your Prosperity,
 
Kevin Kroskey, CFP®, MBA
 
This article adapted with permission from Bob Veres.

Sources:

Future Posts at www.TrueWealthDesign.com

Any future blog posts will be done at www.TrueWealthDesign.com . Thank you, Kevin Kroskey, CFP, MBA