August 9, 2010 Weekly Market Commentary

The Markets

Despite a disappointing jobs report, stocks still managed to post a solid gain last week. In fact, all three major U.S. indexes --the Dow Jones Industrial Average, the S&P 500, and the NASDAQ Composite --ended last week in positive territory for the year, according to CNBC.

Strong corporate earnings are helping to keep a floor under the market. Roughly 75% of the companies that have reported second quarter earnings beat Wall Street estimates, according to CNBC. Of course, one factor that helped corporate America post strong earnings was keeping a tight rein on employment costs. Unfortunately, what’s good for corporate America may not always be good for “employment” America.

Bond yields continued to decline last week as the 2-year Treasury hit a record low of 0.50%. The 10-year Treasury yielded 2.82%, which is a 15-month low. Foreign country bonds are sporting low yields, too. The 10-year German Bund hit a record low yield of 2.51% last week, while the benchmark Japanese 10-year government bond yielded just 1.05% last week, according to Barron’s.

Low yields suggest either slower economic growth ahead or little to no inflation, or both, according to Barron’s. Low rates are generally good for businesses because it makes their cost of capital lower and makes it easier for them to reinvest for future growth. So far, the low rates appear to have helped stabilize the economy, but robust growth and reinvestment has yet to materialize, according to The New York Times.

Overall, the mixed economic data is helping keep the market stuck in a broad range.


“WE ARE IN A NEW NORMAL WORLD in which the distribution of outcomes is flatter and the tails are fatter,” according to a July 2010 Global Perspective report from Richard Clarida of PIMCO. What in the world does that mean?

Clarida’s words might sound like mumbo jumbo, but he actually makes a solid case that planning for “extreme” outcomes rather than “average” outcomes might be the appropriate investment strategy in the current climate.

History tells us that the average annualized total return on the S&P 500 between 1926 and 2009 was 9.9% and the standard deviation was 19.2, according to TD Ameritrade. Standard deviation is a measure of volatility and at 19.2 (one standard deviation), it means that about 68% of the time, we would expect the S&P 500 annual return to be somewhere between a loss of 9.3% and a gain of 29.1%. At two standard deviations, it means that about 95% of the time, we would expect the S&P 500 to return somewhere between a loss of 28.5% and a gain of 48.3%. At three standard deviations, it means that about 99.7% of the time, we would expect the S&P 500 to return somewhere between a loss of 47.7% and gain of 67.5%.

Clarida is suggesting that, in the future, more of the returns in the financial markets will fall in the 2nd or 3rd standard deviation range (the “fat tail”) instead of the 1 standard deviation range (the “hump”). If true, this means we could expect more volatility -- both positive and negative -- in the future.

The future could be more volatile due to such things as the unpredictable nature of government regulation and bailouts, sovereign debt levels, high-frequency trading, geopolitical flare-ups, social unrest, high unemployment, and medical or scientific breakthroughs.

Recent events such as the May 6 “Flash Crash,” the 2008 financial crisis, the 2007-2009 bear market, and the 2008 spike and then collapse in oil prices, support Clarida’s idea that we live in volatile times.

So, if we are temporarily living in a “fat tail” world, then it makes sense to plan accordingly. And, that’s what we’re trying to do on your behalf.


Weekly Focus – Think About It

“Take calculated risks. That is quite different from being rash.”

-- General George S. Patton


Best regards,

Kevin Kroskey


Bookmark and Share


* The Standard & Poor's 500 (S&P 500) is an unmanaged group of securities considered to be representative of the stock market in general.
* The DJ Global ex US is an unmanaged group of non-U.S. securities designed to reflect the performance of the global equity securities that have readily available prices.
* The 10-year Treasury Note represents debt owed by the United States Treasury to the public. Since the U.S. Government is seen as a risk-free borrower, investors use the 10-year Treasury Note as a benchmark for the long-term bond market.
* Gold represents the London afternoon gold price fix as reported by the London Bullion Market Association.
* This newsletter was prepared by PEAK.

* The DJ Commodity Index is designed to be a highly liquid and diversified benchmark for the commodity futures market. The Index is composed of futures contracts on 19 physical commodities and was launched on July 14, 1998.
* The DJ Equity All REIT TR Index measures the total return performance of the equity subcategory of the Real Estate Investment Trust (REIT) industry as calculated by Dow Jones.
* Yahoo! Finance is the source for any reference to the performance of an index between two specific periods.
* Opinions expressed are subject to change without notice and are not intended as investment advice or to predict future performance.
* Past performance does not guarantee future results.
* You cannot invest directly in an index.
* Consult your financial professional before making any investment decision.


August 2, 2010 Weekly Market Commentary

The Markets

Consumers are becoming more frugal and that may turn out to be a good thing.

One cause of The Great Recession was the cumulative effect of consumers spending more money than they could afford. Eventually, they got tapped out, business slowed down, and massive layoffs ensued. Of course, simple math says you cannot indefinitely spend what you do not have and, by 2008, the math caught up with many Americans.

Last week, the Commerce Department said the personal savings rate (saving as a percentage of disposable personal income) rose to 6.2% in the second quarter. That’s up from 5.5% in the first quarter. In the heyday of conspicuous consumption back in 2007, the savings rate was a paltry 2.1%, according to CNNMoney.com.

Higher savings is a double-edged sword. On the positive side, it means consumers are acting more responsibly and, by beefing up savings, they are setting the stage for future sustainable economic growth. The downside to this thriftiness is slower economic growth in the short term.

It’s a fine balance between saving enough to get our personal balance sheet back in order, but not too much that the economy takes years to regain its footing. Remember, consumer spending still accounts for about 70% of economic activity, according to The Wall Street Journal. The trick is we still have to shop -- but just not till we drop!


DOUBLE DIP IS NOT JUST FOR ICE CREAM CONES. Over the past few months, concern has grown that the U.S. economy could experience a double-dip recession. Drooping bond yields, which may suggest slower economic growth, coupled with some soft economic data and weak consumer sentiment, have raised a red flag. However, from an international perspective, the International Monetary Fund has raised its 2010 world economic growth projection five times since April 2009 and it now stands at a forecasted rate of 4.6% -- which is rather healthy and certainly not double-dip territory.

Although the likelihood of a double-dip recession still seems small, a July 27 Financial Times article outlined four risks that could possibly derail the recovery:

1. A decline in business and consumer confidence.
2. An end to temporary boost to post-recession economies, e.g., economic growth emanating from inventory re-stocking.
3. A new crisis or “black swan” event that throws the world for a loop.
4. Overly austere government budgets that tighten too much too soon and snuff out the recovery before it gets a chance to become self-sustaining.

These risks are reasonable and bear watching. However, let’s face it. No matter how well the world is humming, we (advisors) can always find something to worry about. But, that’s our job. It’s not that we’re pessimists. It just comes with the territory. We worry about things -- large and small -- in an effort to be proactive and to try and help you stay ahead of the curve.


Weekly Focus – Think About It

Here’s a list of the happiest countries in the world, according to a recently released Gallup Poll based on data collected between 2005 and 2009. Survey participants were asked to rate their overall satisfaction with their lives and how they had felt the previous day (to gauge their happiness in daily activities).

Rating   Country

  1          Denmark
  2          Finland
  3          Norway
  4          Sweden
  5          Netherlands
  14        United States
  17        United Kingdom
  44        France
  81        Japan
  125      China

Does this list surprise you?


Best regards,

Kevin Kroskey


Bookmark and Share


* The Standard & Poor's 500 (S&P 500) is an unmanaged group of securities considered to be representative of the stock market in general.
* The DJ Global ex US is an unmanaged group of non-U.S. securities designed to reflect the performance of the global equity securities that have readily available prices.
* The 10-year Treasury Note represents debt owed by the United States Treasury to the public. Since the U.S. Government is seen as a risk-free borrower, investors use the 10-year Treasury Note as a benchmark for the long-term bond market.
* This newsletter was prepared by PEAK.
* Gold represents the London afternoon gold price fix as reported by the London Bullion Market Association.
* The DJ Commodity Index is designed to be a highly liquid and diversified benchmark for the commodity futures market. The Index is composed of futures contracts on 19 physical commodities and was launched on July 14, 1998.
* The DJ Equity All REIT TR Index measures the total return performance of the equity subcategory of the Real Estate Investment Trust (REIT) industry as calculated by Dow Jones.
* Yahoo! Finance is the source for any reference to the performance of an index between two specific periods.
* Opinions expressed are subject to change without notice and are not intended as investment advice or to predict future performance.
* Past performance does not guarantee future results.
* You cannot invest directly in an index.
* Consult your financial professional before making any investment decision.

July 26, 2010 Weekly Commentary

The Markets

“The economy is still struggling; too many Americans are still out of work; and the Nation’s long-term fiscal trajectory is unsustainable, threatening future prosperity,” according to the Mid-Session Review submitted by the White House last week. This supplemental update of the annual budget contained a number of projections that are of interest to us. Here are a few:

• A projected federal deficit of $2.9 trillion over the next two fiscal years.
• Gross Domestic Product projected to grow 3.2% this year, 3.6% in 2011, and 4.2% in 2012.
• Unemployment projected to average 9.7% this year, 9.0% in 2011, and 8.1% in 2012. It is projected to stay above 6% until 2015.
• The consumer price index projected to rise 1.6% this year, 1.3% next year, and 1.8% in 2012.
• The 10-year Treasury projected to yield on average 3.5% in 2010, 4.0% in 2011, and 4.6% in 2012.

Projections like this are, of course, notoriously difficult to get right. So much can happen in a short period and throw off the best laid plans. But, looking at the projections at least gives us a place to start. Overall, the projections are a mixed bag. The deficit numbers are problematic. The GDP growth projection is good if we can hit it. The unemployment numbers are painful. The inflation outlook is stable and the Treasury yield is favorable for business growth.

If, by the end of 2012, the above numbers come to fruition, then we would likely avoid a double-dip recession and the economy would probably “muddle along.” So far, corporate America is doing its part by showing really solid earnings for the second quarter. Companies such as Caterpillar, 3M, AT&T, and UPS notched solid quarters and suggest there is underlying strength in the economy, according to MarketWatch. In fact, of the 175 companies in the S&P 500 that have already reported their second quarter earnings, a whopping 78% have beaten analysts’ estimates while only 12% missed, according to data from Thomson Reuters as reported by MarketWatch. Buoyed by good earnings and relief over the European bank stress tests, the S&P 500 rose a solid 3.6% last week.

Given all the volatility we’ve had over the past 2½ years, “muddle along” might not be so bad!


WHETHER AN INVESTOR LEANS BULLISH OR BEARISH, there is ample data to support either view. This situation may explain why Fed Chairman Ben Bernanke told Congress last week that the economic outlook was “unusually uncertain.” For those investors who lean bullish, here are several supporting points courtesy of economist David Rosenberg as reported by Financial Times:

• Congress extended jobless benefits, which is one form of stimulus.
• Some Democrats are now in favor of delaying tax hikes.
• China is having some success slowing its property bubble without bursting it.
• Confidence is growing that the emerging markets may keep world growth positive even if more mature countries slow down.
• Eurozone debt and money markets have settled down after the problems with Greece sparked default fears.
• The European bank stress tests contained no major surprises and added clarity to the soundness of the banking system.
• Consumer credit delinquency rates in the U.S. are improving.
• Mortgage delinquencies in California, one of the hardest hit real estate markets, are at a three-year low.
• The BP oil spill is coming under control and is no longer each day’s top headline.
• The passage of the financial regulation bill removed one more cloud of uncertainty.
• Corporate America is reporting solid earnings for the second quarter and their future outlook has been, on balance, positive.
• Fed Chairman Ben Bernanke indicated he’ll keep using monetary policy to stimulate the economy and he’ll get even more aggressive if need be.

So, yes, there are reasons why the markets and the economy could do okay in the months to come. But, in this “unusually uncertain” time, almost anything is possible.

Best regards,

Kevin Kroskey

Bookmark and Share

* The Standard & Poor's 500 (S&P 500) is an unmanaged group of securities considered to be representative of the stock market in general.
* The DJ Global ex US is an unmanaged group of non-U.S. securities designed to reflect the performance of the global equity securities that have readily available prices.
* The 10-year Treasury Note represents debt owed by the United States Treasury to the public. Since the U.S. Government is seen as a risk-free borrower, investors use the 10-year Treasury Note as a benchmark for the long-term bond market.
* Gold represents the London afternoon gold price fix as reported by the London Bullion Market Association.
* The DJ Commodity Index is designed to be a highly liquid and diversified benchmark for the commodity futures market. The Index is composed of futures contracts on 19 physical commodities and was launched on July 14, 1998.
* The DJ Equity All REIT TR Index measures the total return performance of the equity subcategory of the Real Estate Investment Trust (REIT) industry as calculated by Dow Jones.
* This newsletter was prepared by PEAK.
* Yahoo! Finance is the source for any reference to the performance of an index between two specific periods.
* Opinions expressed are subject to change without notice and are not intended as investment advice or to predict future performance.
* Past performance does not guarantee future results.
* You cannot invest directly in an index.
* Consult your financial professional before making any investment decision.

July 19, 2010 Weekly Commentary

The Markets

What is the most actively traded security on the planet?

The answer is the two-year Treasury note and its current yield is sending us a signal, according to Bloomberg, July 17. Last week, the yield on the two-year note fell for the seventh straight week and touched its lowest level ever. At just under 0.6%, it is now lower than during the peak of the financial crisis in the fall of 2008.

What does this signal?

In short, it suggests the economy is slowing down, inflation is not a threat, deflation is a possibility, and money-market rates will remain historically low, according to BusinessWeek, July 15, Barron’s, July17, and Bloomberg, July 17. Here’s a list of several economic reports released last week that help support this view:

• The consumer price index dropped for the third straight month in June, according to data from the Labor Department (Market Watch, July 16).
• Industrial production rose a modest 0.1% in June after having risen 1.2% in May, according to the Federal Reserve, July 15.
• Another report released by the Federal Reserve, June 22, said, “The economic outlook had softened somewhat and a number of members saw the risks to the outlook as having shifted to the downside.”

While the data above points toward economic softness, second quarter corporate profits are coming in strong. Of the 48 companies in the S&P 500 index that have reported their earnings, 75% have topped analysts’ estimates, including a blow-out quarter from Intel, according to Reuters, July 16.

The tug-of-war between soft economic data and strong corporate profits is helping keep the market stuck in a bouncy trading range.


HOW DO YOU SOLVE A PROBLEM LIKE JOBS?

This question has a double meaning--jobs as in employment and Jobs as in Steve Jobs of Apple.

Chronically high unemployment in the U.S. is having a debilitating effect on our economy. We can point to many causes for this, but one that receives lots of press is the outsourcing of jobs overseas--and that’s where Steve Jobs comes in.

Without getting into a political debate about the pros and cons of free trade, it turns out that in a little recognized fact, Apple is one of the biggest beneficiaries of outsourcing jobs overseas. We can’t get enough iPods, iPhones, iPads, and Macs, but relatively few of the jobs created by our insatiable demand are sprouting on our shores.

According to Apple and BusinessWeek, as of September 26, 2009, Apple had about 37,000 full-time equivalent employees of which about 25,000 were based in the U.S. By contrast, Apple has subcontracted with a Chinese company called Foxconn that employs roughly 250,000 people who are devoted to building Apple products. Doing the math, for every one Apple employee working in the U.S., there are 10 Foxconn employees building Apple products in China. Knowing that costs are much lower in China (and that Apple products are in high demand), is it any surprise that Apple earned $3 billion in profit with a 42% gross margin in the first three months of this year?

Again, this is not meant to start a political debate about free trade or protectionism as there are many facets to this issue. It simply points out the intractable nature of high unemployment in the U.S., particularly in the manufacturing sector. Some people argue that free trade and capitalism are the best ways to grow jobs and profits. Others, notably former Intel chairman and chief executive officer Andrew Grove (Bloomberg, July 1), argue for protectionist measures to rebuild our domestic manufacturing base. Ultimately, America needs to get its people back to work. The Apple example shows just how difficult that may be.

Weekly Focus – Think About It

“I want to put a ding in the universe.”

--Steve Jobs


Best regards,

Kevin Kroskey

Bookmark and Share

* The Standard & Poor's 500 (S&P 500) is an unmanaged group of securities considered to be representative of the stock market in general.
* The DJ Global ex US is an unmanaged group of non-U.S. securities designed to reflect the performance of the global equity securities that have readily available prices.


* The 10-year Treasury Note represents debt owed by the United States Treasury to the public. Since the U.S. Government is seen as a risk-free borrower, investors use the 10-year Treasury Note as a benchmark for the long-term bond market.
* Gold represents the London afternoon gold price fix as reported by the London Bullion Market Association.
* The DJ Commodity Index is designed to be a highly liquid and diversified benchmark for the commodity futures market. The Index is composed of futures contracts on 19 physical commodities and was launched on July 14, 1998.
* The DJ Equity All REIT TR Index measures the total return performance of the equity subcategory of the Real Estate Investment Trust (REIT) industry as calculated by Dow Jones.
* Yahoo! Finance is the source for any reference to the performance of an index between two specific periods.
* Opinions expressed are subject to change without notice and are not intended as investment advice or to predict future performance.
* This newsletter was prepared by PEAK.* Past performance does not guarantee future results.


* You cannot invest directly in an index.
* Consult your financial professional before making any investment decision.

July 12, 2010 Weekly Commentary

The Markets

Wall Street investors are sure a fickle crowd these days.

After dropping 16% between April 23 and July 2, the S&P 500 recouped one-third of that loss last week and rose 5.4%, according to Bloomberg, July 10. Stocks rose on news that U.S. retail sales grew at the fastest pace in four years in June and a bullish report from the IMF projected an upwardly revised global economic growth rate of 4.6% in 2010, according to CNBC, July 8. Rising optimism that second quarter earnings reports might be better than expected also supported stock prices last week, according to MarketWatch, July 7.

Although the market jumped dramatically, has much changed in the past week? Maybe, maybe not. Wall Street observers have a tidy tendency to explain every movement in the market with an explanation that seems, on the surface, to be reasonable. Last week’s bullish reports on retail sales, world economic growth, and some earnings pre-announcements all seem like logical explanations for the big rise in the market. However, between April 23 and July 2, when the market dropped 16%, we were reading reports that retail sales were weak, economic growth was slowing, and we might be heading for a double-dip recession. Now, a week later, the economy seems to have turned a corner, right?

In reality, the truth is probably somewhere in between. The economy may not have been as bad as the 16% market swoon suggested and it may not be as good as last week’s 5.4% pop suggests, either. It’s good to stay informed but we have to filter information with a dose of skepticism.


DOES THE LARGE U.S. BUDGET DEFICIT MATTER?
Below is a chart of our annual budget surplus/deficit for the past few years.


Notice how our budget deficit has soared over the past three years as the recession took its toll. Surprisingly, it was just nine years ago that we ran a budget surplus of $128 billion. On a cumulative basis, the national debt is $13.2 trillion, according to the Treasury Department. So, should we be concerned that our annual deficit and national debt are rising dramatically?

Without meaning to be glib, deficits don’t matter until they do. Just ask Greece.

Currently, financial markets are relatively unconcerned about our debt level. Investors’ lack of concern shows up in the fact that interest rates on government bonds are near historic lows and the spread between interest rates on inflation-protected Treasury bonds and regular bonds is a mild 2.3%, according to MSN, July 9. If investors were concerned about our debt level, they’d send interest rates skyrocketing (as happened in Greece) and inflation might rear its head if the government cranked up the printing press to monetize our debt.

Investors are not alarmed at our large debt level because they still have confidence that our country will weather the storm. However, investors could lose confidence if, for example, we experience some new shock or a “failed” Treasury auction. If that happens, confidence could dissipate rather quickly and throw our economy into disarray.

Nobody knows if this will happen or not, but we continue to monitor interest rates and inflation expectations as early indicators to help determine if confidence is slipping.


Best regards,


Kevin Kroskey, CFP(r), MBA


Bookmark and Share

* The DJ Global ex US is an unmanaged group of non-U.S. securities designed to reflect the performance of the global equity securities that have readily available prices.
* The 10-year Treasury Note represents debt owed by the United States Treasury to the public. Since the U.S. Government is seen as a risk-free borrower, investors use the 10-year Treasury Note as a benchmark for the long-term bond market.
* Gold represents the London afternoon gold price fix as reported by the London Bullion Market Association.
* The DJ Commodity Index is designed to be a highly liquid and diversified benchmark for the commodity futures market. The Index is composed of futures contracts on 19 physical commodities and was launched on July 14, 1998.
* The DJ Equity All REIT TR Index measures the total return performance of the equity subcategory of the Real Estate Investment Trust (REIT) industry as calculated by Dow Jones.
* Yahoo! Finance is the source for any reference to the performance of an index between two specific periods.
* Opinions expressed are subject to change without notice and are not intended as investment advice or to predict future performance.
* Past performance does not guarantee future results.
* This newsletter was prepared by PEAK.

* You cannot invest directly in an index.
* Consult your financial professional before making any investment decision.

July 6, 2010 Weekly Commentary

The Second Quarter in Review


STOCK MARKET RALLY FALTERS ON "MACRO" ISSUES

The stock market rally that began in March 2009 came to an abrupt halt in the second quarter. Despite excellent first quarter corporate earnings in the U.S., investors fretted about larger issues that could overwhelm the economy in the months ahead. These "macro" issues include unsustainable government debt levels in numerous countries, the unwinding of stimulus spending, possible deflation, persistently high unemployment, financial regulation, and a government-orchestrated economic slowdown in China, according to The Wall Street Journal, June 30. These concerns helped send the S&P 500 index to an 11.9% decline in the quarter.


ECONOMY SLOWS DOWN

A variety of economic reports over the past few weeks suggest the economy is slowing down. For example, home sales dropped, consumer confidence slumped, manufacturing growth cooled off, and new claims for unemployment insurance remained high, according to Bloomberg, July 3. However, let's not get too carried away. A slowdown does not necessarily mean we are headed for another recession.

Today's weak economy puts policymakers in a tough spot. Normally, fiscal and monetary stimulus is enough to jumpstart growth. Unfortunately, we've shot those two rockets and we still haven't reached escape velocity. If the economy rolls over from here, the question becomes, "Where do we find a third rocket?" According to Tony Crescenzi, strategist and portfolio manager at Pimco, CNBC.com, June 7, our third rocket might consist of time, devaluations, and debt restructurings. If fired, this third rocket could be painful for many Americans.

INTEREST RATES DIVERGE BASED ON RISK PERCEPTION

As the stock market declined, yields on U.S. government securities declined, too, as investors fled to the perceived safety of our government paper. During the quarter, the yield on the 10-year note declined from 3.8% to 3.0%, according to data from Yahoo! Finance. This decline in yield occurred even though the government issued more than $300 billion in new debt during the quarter, according to The Wall Street Journal, July 1. It was a different story in the corporate bond arena. Yields on investment-grade corporate bonds and high-yield corporate (junk) bonds rose as investors began pricing in added economic risk. In a sign of growing risk aversion, the spread between yields on corporate bonds and government bonds rose significantly, as investors required a higher yield to hold the potentially riskier corporate bonds.

THE DOLLAR REMAINS POPULAR

Some naysayers think the dollar's days are numbered, but that countdown had yet to begin in the second quarter. The dollar index, a measure of the dollar's strength compared to a trade-weighted basket of six other currencies, rose a solid 5.9% in the second quarter, according to MarketWatch, June 30. Two major trends are apparently tugging at the dollar and in any given week, one trend seems to outweigh the other. The euro zone debt crisis helped spark a flight to the U.S. dollar and was a major reason why the dollar jumped sharply in the second quarter. However, toward the end of the quarter, disappointing economic numbers out of the U.S. and new austerity measures in the euro zone led some investors to rethink their dollar-haven strategy.

SUMMARY

The recovery from the recession hit a rough patch in the second quarter as several economic indicators turned soft and the stock market turned south. It's too soon to tell if this is the start of a new leg down or simply a pause that refreshes.

Weekly Focus – Think About It
“Psychology is probably the most important factor in the market--and one that is least understood.”

--David Dreman


Best regards,

Kevin Kroskey

Bookmark and Share

* The Standard & Poor's 500 (S&P 500) is an unmanaged group of securities considered to be representative of the stock market in general.

* The DJ Global ex US is an unmanaged group of non-U.S. securities designed to reflect the performance of the global equity securities that have readily available prices.
* The 10-year Treasury Note represents debt owed by the United States Treasury to the public. Since the U.S. Government is seen as a risk-free borrower, investors use the 10-year Treasury Note as a benchmark for the long-term bond market.
* Gold represents the London afternoon gold price fix as reported by the London Bullion Market Association.
* The DJ Commodity Index is designed to be a highly liquid and diversified benchmark for the commodity futures market. The Index is composed of futures contracts on 19 physical commodities and was launched on July 14, 1998.
* The DJ Equity All REIT TR Index measures the total return performance of the equity subcategory of the Real Estate Investment Trust (REIT) industry as calculated by Dow Jones.
* This newsletter was prepared by PEAK.
* Yahoo! Finance is the source for any reference to the performance of an index between two specific periods.
* Opinions expressed are subject to change without notice and are not intended as investment advice or to predict future performance.
* Past performance does not guarantee future results.
* You cannot invest directly in an index.
* Consult your financial professional before making any investment decision.

June 28, 2010 Weekly Commentary

The Markets

Can world governments "cut" their way to prosperity?

It's no secret that many countries are incurring large--and unsustainable--budget deficits. What's interesting is the approach each country is taking to try to lower their deficits to a manageable level. Britain, Japan, Germany, and Greece, for example, are focused on cutting government spending, according to Bloomberg, June 22. Conversely, the U.S., while concerned about government spending, seems more focused on keeping the stimulus spending alive and raising taxes until (hopefully) the economy can catch fire and grow on its own.

Who's right?

According to Harvard University professor Alberto Alesina, “There have been mountains of evidence in which cutting government spending has been associated with increases in growth, but people still don’t quite get it.” In addition, a study by Ben Broadbent and Kevin Daly of Goldman Sachs Group, Inc. as reported by Bloomberg on June 22, "discovered that reducing expenditures by 1 percentage point a year boosted average annual growth by 0.6 percentage point. Raising the ratio of taxes to GDP by the same margin cut growth by an average 0.9 percentage point." And, from a stock market perspective, the same report said, "The equity markets of the countries that sliced spending beat those of other advanced nations by 64% during a three-year period."

Like many things related to finance and economics, we won't know "who's right" until time passes and the market delivers its verdict. Between now and then, expect the vigorous debate on spending cuts versus stimulus spending to continue among academics, investors, and world leaders.

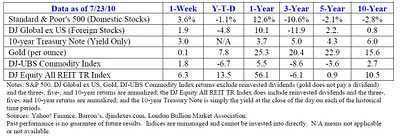
Notes: S&P 500, DJ Global ex US, Gold, DJ-UBS Commodity Index returns exclude reinvested dividends (gold does not pay a dividend) and the three-, five-, and 10-year returns are annualized; the DJ Equity All REIT TR Index does include reinvested dividends and the three-, five-, and 10-year returns are annualized; and the 10-year Treasury Note is simply the yield at the close of the day on each of the historical time periods.
Sources: Yahoo! Finance, Barron’s, djindexes.com, London Bullion Market Association.
Past performance is no guarantee of future results. Indices are unmanaged and cannot be invested into directly. N/A means not applicable or not available.

ARE THE FINANCIAL MARKETS "NORMALLY DISTRIBUTED" and should you even care? Consider this. The average height of an American male is 69.4 inches, according to the National Center for Health Statistics, October 22, 2008. If we randomly chose 1,000 American males and calculated their average height, we would likely come up with a number close to 69.4 inches. Now, in an un-random fashion, let's assume we found an 8-foot tall man--who is clearly an extreme outlier--and we have him join the previous group of 1,000. By recalculating the data, we now find the average height of this group of 1,001 men jumps by a very underwhelming 0.03 inches. In other words, adding an extremely tall outlier to this group of average height men had very little effect on the overall average height of the group. Without getting too technical and assuming "tall outliers" are just as likely to be found as "short outliers," we can say the height of men follows a "bell curve" or a normal distribution.

By contrast, let's consider the average net worth of American households. According to the Federal Reserve, February 2009, the average American family had a net worth of $556,300 in 2007. Like above, if we randomly chose 1,000 families, this group would probably have an average net worth near $556,300. However, for fun, let's add Warren Buffett--and his $40 billion net worth--to the group. Recalculating the data, we find the average net worth of this group of 1,001 Americans jumps to $40.5 million! Clearly, adding an extreme outlier to this sample dramatically changed the average of the sample.

As it relates to the financial markets, do you think their distribution of returns looks more like the average height of American men (where an extreme outlier doesn't really affect the average) or the average net worth of American households (where an extreme outlier could have an extreme impact)? If you think the returns in financial markets look like the average height of American men, but it turns out they behave more like the average net worth of American households, you could lose a lot of money. In fact, much of modern portfolio theory is based on the assumption that financial markets follow a normal distribution, i.e., they look like the average height of American men. Unfortunately, experience suggests otherwise.

Warren Buffett-type outliers such as the October 1987 stock market crash, the 2000-2002 bursting of the internet bubble, the 2007-2009 bear market, the 2008 credit crisis, and last month's "flash crash," suggest that the financial markets are subject to large outliers that can significantly affect your financial well-being. Knowing that, you must to try to limit the damage to your portfolio if one of these outliers occurs during your investing lifetime. Modern portfolio theory works, but financial planning done right can mitigate the risks of outliers.

Weekly Focus – Think About It
"In the business world, the rearview mirror is always clearer than the windshield."
--Warren Buffett

Best regards,

Kevin Kroskey

Bookmark and Share

* The Standard & Poor's 500 (S&P 500) is an unmanaged group of securities considered to be representative of the stock market in general.
* The DJ Global ex US is an unmanaged group of non-U.S. securities designed to reflect the performance of the global equity securities that have readily available prices.
* The 10-year Treasury Note represents debt owed by the United States Treasury to the public. Since the U.S. Government is seen as a risk-free borrower, investors use the 10-year Treasury Note as a benchmark for the long-term bond market.
* Gold represents the London afternoon gold price fix as reported by the London Bullion Market Association.
* The DJ Commodity Index is designed to be a highly liquid and diversified benchmark for the commodity futures market. The Index is composed of futures contracts on 19 physical commodities and was launched on July 14, 1998.
* The DJ Equity All REIT TR Index measures the total return performance of the equity subcategory of the Real Estate Investment Trust (REIT) industry as calculated by Dow Jones.
* This newsletter was prepared by PEAK.
* Yahoo! Finance is the source for any reference to the performance of an index between two specific periods.
* Opinions expressed are subject to change without notice and are not intended as investment advice or to predict future performance.
* Past performance does not guarantee future results.
* You cannot invest directly in an index.
* Consult your financial professional before making any investment decision.

Future Posts at www.TrueWealthDesign.com

Any future blog posts will be done at www.TrueWealthDesign.com . Thank you, Kevin Kroskey, CFP, MBA