Where does 2 + 2 = billions of dollars? In the stock market, of course!
Back in the “good ol’ days,” investment professionals would spend their waking hours poring over financial statements, developing financial models, and analyzing reports to try and find undervalued stocks. The thought was you could find stocks that were selling below their “intrinsic value,” and, if you held them long enough, you would likely earn a nice return. Warren Buffett exemplifies this style of investing.
Today, with an interconnected world filled with impatient “fast traders” and economic uncertainty, there seems to be a fixation on the latest data released by Washington or some other business group that has its pulse on a sector of the economy. Last week, we had two great examples of how the publication of certain data helped move the markets.
On Wednesday, the Institute for Supply Management said its closely watched index of factory activity rose to 56.3% in August from 55.5% in July, according to The Wall Street Journal. This number was better than expected and suggested the manufacturing sector of the economy was holding up well. A similar report on China’s manufacturing sector also showed an unexpected rise. Stocks reacted by jumping 2.5% that day as measured by the Dow Jones Industrial Average.
And on Friday, the government released the August nonfarm payroll report and it was better than expected, according to CNBC. Stocks jumped on the news and the Dow rose 1.2% as fears of continuing gloom in the job market eased a bit.
So, the release of two reports in two days, (the 2 + 2), helped the stock market as measured by the Dow soar 3.7% and add billions of dollars in market value, according to data from Wilshire Associates.
In this type of data-driven market, trigger-happy traders can help cause big swings -- both up and down -- that tempt some investors into thinking that either the end of the world is near or happy days are here again. Ultimately, two pieces of data in two days may help add (or subtract) billions in market value, but they are insufficient to discern a new trend. Intrinsic value still matters over time, and daily data, while helpful, is only part of the puzzle of investing.

HOW THE RICH SPEND THEIR MONEY may have a big impact on the pace of our economic recovery. Consider this, the top 5% of Americans by income account for 37% of all consumer outlays, according to an August 5 Wall Street Journal article that was based on data from Moody’s Analytics. At the other end of the spectrum, the bottom 80% by income account for 39.5% of all consumer outlays. So much for the 80/20 rule!
The share of spending by the top 5% has grown over the years, too. Back in the third quarter of 1990, the top 5% accounted for 25% of consumer outlays versus the 37% today, according to the Journal article.
In a 2005 research report, analysts at Citigroup coined the phrase “Plutonomy” to describe countries that exhibit significant income and wealth inequality. Plutonomies also are disproportionately dependent on the spending habits of the wealthy. According to that 2005 report, Citigroup classified the U.S., U.K., Canada, and Australia as Plutonomies.
So, if you want to know where the economy is heading—follow the money!
Weekly Focus – Think About It
“If you start small, dream big, plant a seed of intention, and care for it, it’s not unrealistic to expect something marvelous to come up.”
--Marc Ian Barasch
Best regards,
Kevin Kroskey
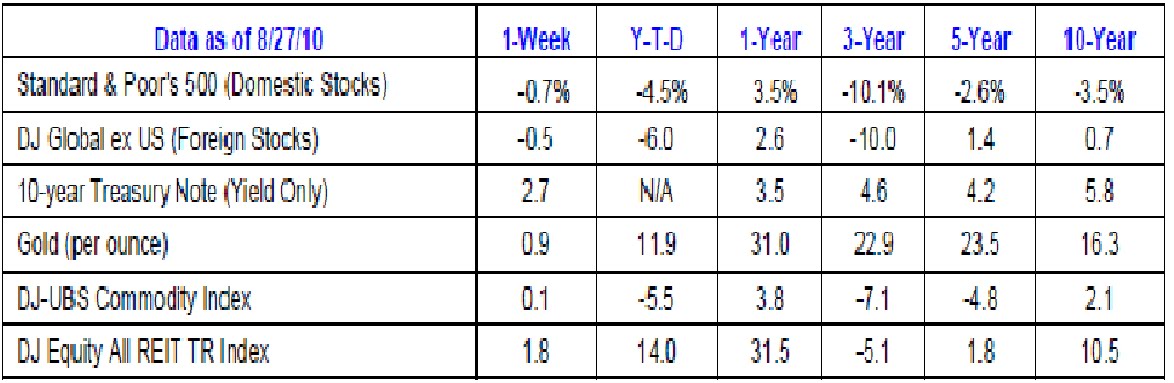
* The Standard & Poor's 500 (S&P 500) is an unmanaged group of securities considered to be representative of the stock market in general.
* The DJ Global ex US is an unmanaged group of non-U.S. securities designed to reflect the performance of the global equity securities that have readily available prices.
* The 10-year Treasury Note represents debt owed by the United States Treasury to the public. Since the U.S. Government is seen as a risk-free borrower, investors use the 10-year Treasury Note as a benchmark for the long-term bond market.
* Gold represents the London afternoon gold price fix as reported by the London Bullion Market Association.
* The DJ Commodity Index is designed to be a highly liquid and diversified benchmark for the commodity futures market. The Index is composed of futures contracts on 19 physical commodities and was launched on July 14, 1998.
* The DJ Equity All REIT TR Index measures the total return performance of the equity subcategory of the Real Estate Investment Trust (REIT) industry as calculated by Dow Jones.
* Yahoo! Finance is the source for any reference to the performance of an index between two specific periods.
* Opinions expressed are subject to change without notice and are not intended as investment advice or to predict future performance.
* Past performance does not guarantee future results.
* You cannot invest directly in an index.
* Consult your financial professional before making any investment decision.
* This newsletter was prepared by PEAK.