When is a dollar not worth a dollar?
A McDonald’s Big Mac costs an average of $3.71 in the United States, according to an October 14 article from The Economist. Just across the border in Canada, that same burger costs $4.18 based on the October 13 exchange rate. In the Euro area, you’d have to shell out $4.79 to quench your Mac attack. But, if you’re really hungry, you should forget going to Switzerland because a Big Mac there will set you back a whopping $6.78 at the going exchange rate.
So, a dollar is not worth a dollar when its value declines relative to another country’s currency such as the ones above. The dollar is also weak against the Japanese yen, where it fell to a 15-year low last week, and the Australian dollar, where it fell to a nearly 30-year low, according to MarketWatch.
What’s going on here?
Essentially, the combination of economic weakness in the U.S., extremely low interest rates, and our country’s easy money policy, have conspired to reduce the value of our currency relative to some other countries. And, as our government knows, a weak currency can be a net positive -- as long as it doesn’t get too weak.
According to an October 1 weekly update from Linda Duessel at Federated Investors, “Currency depreciation is the most politically palatable way to deal with both deficits and slow growth. Unfortunately, history suggests depreciating the dollar is the worst possible way to deal with public debt. It spawns inflation, stifles growth and eats away at earnings.”
The relatively weak value of the dollar may not crimp your day-to-day lifestyle right now. However, as an advisor, it’s an important macro indicator that could impact the value of your portfolio -- and your pocketbook -- if it gets too far outside of historical norms. It bears watching.
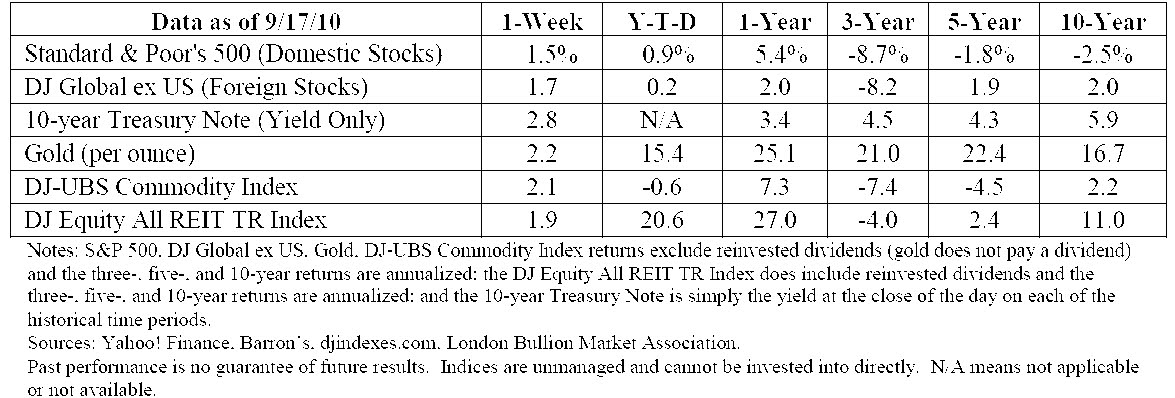
(Click on the picture below to enlarge the table in a new window.)

WHILE THE PURCHASING POWER OF THE DOLLAR can be analyzed using a Big Mac, it can also be analyzed using something less edible -- gold. Gold has been considered a medium of exchange for several thousand years, according to the National Mining Association. And, for some people, it is the soundest “currency” in existence today because it is scarce, it can’t be printed (mined) freely, and it has a long history of being valuable and tradable even though it generally has zero commercial use other than for jewelry.
Measuring the value of the dollar in terms of gold is quite simple. All you do is plot the dollar cost of one ounce of gold over time. Back in the early 1930s when our country was on the gold standard, gold was set at a fixed price of $20.67 per ounce, according to The Economist. In the early 1970s, the last vestiges of the gold standard were removed and the price of gold was allowed to reach a “market” price. As of last week, that market price was over $1,300 per ounce.
The rise of gold from $20 an ounce to over $1,300 an ounce was effectively a massive devaluation of the dollar, according to The Economist. Had you bought an ounce of gold in 1930 for $20 and held it to today, you could sell it for more than $1,300, which is a return moderately above inflation over the timer period. However, dad you just sat on your $20, it would still be worth $20, but it would buy you less than 1/50th of an ounce of gold.
The funny thing about gold is that it’s not an “investment” in the traditional sense because it does not pay a dividend and it does not generate cash flow. It just sits there and looks really pretty. I would say it's more of a speculation than an investment given its characteristics. And for those gold bugs, gold is still markedly below it's inflation-adjusted high reached in the 1980s and did virtually nothing for 20 long years. It's just the 'speculation du jour' because it has recently done well.
Weekly Focus – Think About It
“More gold has been mined from the thoughts of men than has been taken from the earth.”
--Napoleon Hill
Best regards,
Kevin Kroskey
* The Standard & Poor's 500 (S&P 500) is an unmanaged group of securities considered to be representative of the stock market in general.
* The DJ Global ex US is an unmanaged group of non-U.S. securities designed to reflect the performance of the global equity securities that have readily available prices.
* The 10-year Treasury Note represents debt owed by the United States Treasury to the public. Since the U.S. Government is seen as a risk-free borrower, investors use the 10-year Treasury Note as a benchmark for the long-term bond market.
* Gold represents the London afternoon gold price fix as reported by the London Bullion Market Association.
* The DJ Commodity Index is designed to be a highly liquid and diversified benchmark for the commodity futures market. The Index is composed of futures contracts on 19 physical commodities and was launched on July 14, 1998.
* The DJ Equity All REIT TR Index measures the total return performance of the equity subcategory of the Real Estate Investment Trust (REIT) industry as calculated by Dow Jones.
* Yahoo! Finance is the source for any reference to the performance of an index between two specific periods.
* Opinions expressed are subject to change without notice and are not intended as investment advice or to predict future performance.
* Past performance does not guarantee future results.
* You cannot invest directly in an index.
* Consult your financial professional before making any investment decision.
* This newsletter was prepared by PEAK.