May 9, 2011 Weekly Market Commentary

HIRING IMPROVES IN APRIL
The Labor Department’s latest jobs report contained some good news: the private sector added 268,000 new jobs last month, and overall non-farm payrolls increased by 244,000 in April. The private sector hasn’t seen this much month-over-month job creation since February 2006, and the net gain of 244,000 jobs was the best since June 2010. The unemployment rate went up to 9.0% in April, but Wall Street rallied Friday after the report was released.1

PMI INDEX STRONG; SERVICE SECTOR INDEX SLIPS
Last week, the Institute for Supply Management released its April reports on the manufacturing and service sectors. While the manufacturing index came in at 60.4 – down slightly from March’s 61.2 – anything above 60 indicates a booming sector. The non-manufacturing index dropped to 52.8 from March’s 57.3 reading. Anything above 50 means growth, but the index hasn’t been this low in eight months.2

GOLD, SILVER & OIL PULL BACK
Are commodities overbought? That anxiety weighed on the futures markets last week, and it was amplified by a strengthening dollar. Silver took the biggest hit, retreating 27.4% across five days to $35.28 an ounce at the Friday COMEX close. Gold lost 4.2% to end the week at $1,491.20 per ounce; copper sank 4.9% for the week, leaving it 14% under its February 14 record close on Friday. Oil slid 14.7% last week, all the way down to $97.18 per barrel at the Friday close; crude had its poorest week since mid-December of 2008.3,4

A VOLATILE WEEK SEES STOCKS RETREAT
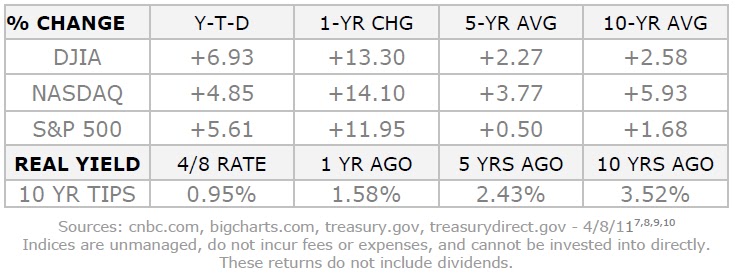
Stocks rollercoastered a bit last week as closely watched indicators alternately came in positive and negative. By Friday’s close, the scorecard for May 3-6 looked like this: DJIA, -1.34% to 12,638.74; S&P 500, -1.72% to 1,340.20; NASDAQ, -1.60% to 2,827.56. (The “flash crash” occurred on May 6, 2010 – that’s why the 1-YR CHG column below shows such radical improvement this week.)5

THIS WEEK: No major economic releases are scheduled for Monday. On Tuesday, we have a report on March wholesale inventories and 1Q earnings from Disney. On Wednesday, three Federal Reserve Bank presidents speak and 1Q earnings from Toyota, Symantec and Cisco arrive. Thursday, the April PPI is released and the newest reports on initial jobless claims arrive; we get the Census Bureau’s report on April retail sales along with 1Q earnings from three titans of the mall – Nordstrom, Macy’s and Kohl’s. Friday, we get April’s CPI and the University of Michigan’s initial consumer sentiment survey for May.
WEEKLY QUOTE
“That which seems the height of absurdity in one generation often becomes the height of wisdom in the next.”
– John Stuart Mill

WEEKLY TIP
If you have adult children living at home, do they pay rent? It can provide you with a source of extra income.

Best Regards,
Kevin Kroskey

Bookmark and Share


This material was prepared by Peter Montoya Inc., and does not necessarily represent the views of the presenting party, nor their affiliates. This information should not be construed as investment, tax or legal advice. The Dow Jones Industrial Average is a price-weighted index of 30 actively traded blue-chip stocks. The NASDAQ Composite Index is an unmanaged, market-weighted index of all over-the-counter common stocks traded on the National Association of Securities Dealers Automated Quotation System. The Standard & Poor's 500 (S&P 500) is an unmanaged group of securities considered to be representative of the stock market in general. It is not possible to invest directly in an index. NYSE Group, Inc. (NYSE:NYX) operates two securities exchanges: the New York Stock Exchange (the “NYSE”) and NYSE Arca (formerly known as the Archipelago Exchange, or ArcaEx®, and the Pacific Exchange). NYSE Group is a leading provider of securities listing, trading and market data products and services. The New York Mercantile Exchange, Inc. (NYMEX) is the world's largest physical commodity futures exchange and the preeminent trading forum for energy and precious metals, with trading conducted through two divisions – the NYMEX Division, home to the energy, platinum, and palladium markets, and the COMEX Division, on which all other metals trade. Additional risks are associated with international investing, such as currency fluctuations, political and economic instability and differences in accounting standards. All information is believed to be from reliable sources; however we make no representation as to its completeness or accuracy. All economic and performance data is historical and not indicative of future results. Market indices discussed are unmanaged. Investors cannot invest in unmanaged indices. The publisher is not engaged in rendering legal, accounting or other professional services. If assistance is needed, the reader is advised to engage the services of a competent professional.

Citations.
1 - cnbc.com/id/42928731/ [5/6/11]
2 - zacks.com/stock/news/52612/ISM+Service+Index+Disappoints [5/4/11]
3 - blogs.wsj.com/marketbeat/2011/05/06/silver-finishes-its-brutal-week-with-a-whimper/ [5/6/11]
4 - blogs.wsj.com/marketbeat/2011/05/06/data-points-energy-metals-489/ [5/6/11]
5 - cnbc.com/id/42935357 [5/6/11]
6 - bigcharts.marketwatch.com/historical/default.asp?symb=DJIA&closeDate=5%2F6%2F10&x=0&y=0 [5/6/11]
6 - bigcharts.marketwatch.com/historical/default.asp?symb=COMP&closeDate=5%2F6%2F10&x=10&y=18 [5/6/11]
6 - bigcharts.marketwatch.com/historical/default.asp?symb=SPX&closeDate=5%2F6%2F10&x=0&y=0 [5/6/11]
6 - bigcharts.marketwatch.com/historical/default.asp?symb=DJIA&closeDate=5%2F5%2F06&x=0&y=0 [5/6/11]
6 - bigcharts.marketwatch.com/historical/default.asp?symb=COMP&closeDate=5%2F5%2F06&x=0&y=0 [5/6/11]
6 - bigcharts.marketwatch.com/historical/default.asp?symb=SPX&closeDate=5%2F5%2F06&x=0&y=0 [5/6/11]
6 - bigcharts.marketwatch.com/historical/default.asp?symb=DJIA&closeDate=5%2F7%2F01&x=0&y=0 [5/6/11]
6 - bigcharts.marketwatch.com/historical/default.asp?symb=COMP&closeDate=5%2F7%2F01&x=0&y=0 [5/6/11]
6 - bigcharts.marketwatch.com/historical/default.asp?symb=SPX&closeDate=5%2F7%2F01&x=0&y=0 [5/6/11]
7 - treasury.gov/resource-center/data-chart-center/interest-rates/Pages/TextView.aspx?data=realyield [5/6/11]
7 - treasury.gov/resource-center/data-chart-center/interest-rates/Pages/TextView.aspx?data=realyieldAll [5/6/11]
8 - treasurydirect.gov/instit/annceresult/press/preanre/2001/ofm11001.pdf [1/10/01]
9 - montoyaregistry.com/Financial-Market.aspx?financial-market=an-introduction-to-the-stock-market&category=29 [5/8/11]

April 25, 2011 Weekly Market Commentary


S&P PUTS THE U.S. CREDIT RATING OUTLOOK TO NEGATIVE? 
Standard & Poor’s rattled Wall Street early last week when it revised its outlook on U.S. long-term debt from “stable” to “negative”. I'm not sure if S&P was trying to make a statement of "we're on top of things" after they surely weren't in regards to the exotic mortgage instruments of years past. Regardless of the reason, their action was utterly foolish and absurd. Across the next three trading days, earnings sent the market higher. The four-day week turned into a winning one, as the numbers show: DJIA, +1.33% to 12,505.99; S&P 500, +1.34% to 1,337.38; NASDAQ, +2.01% to 2,820.16.5,6

HOME SALES, HOME STARTS IMPROVE IN MARCH
The National Association of Realtors announced that existing home sales were up 3.7% last month, about 1% higher than the rebound expected on Wall Street. (NAR noted that about 35% of these were cash sales.) In another positive development for the real estate market, the Commerce Department measured a 7.2% gain in housing starts and an 11.2% rise in construction permits for March.1

GOLD AT NEW HIGH, DOLLAR TOUCHES 3-YEAR LOW
Gold cracked the $1,500 ceiling last week. Prices reached $1,508.75 on Thursday before settling at $1,503.80 on the COMEX. Silver hit yet another 31-year high at $46.68 per ounce, with prices ending the week at $46.06. Meanwhile, the U.S. Dollar Index descended to 73.735 during the market day on Thursday, a low unseen since August 2008.2,3

LEI INDEX UP FOR NINTH STRAIGHT MONTH
The Conference Board’s index of leading economic indicators rose another 0.4% for March, complementing a revised 1.0% gain in February. Economists polled by Bloomberg News had forecast a 0.3% advance.4

THIS WEEK: The height of earnings season is upon us. On tap for Monday, we have 1Q results from Netflix and March new home sales data. Tuesday offers earnings reports from Coca-Cola, UPS, 3M, Delta Air Lines, Valero, Ford, Western Union, U.S. Steel, Broadcom and Amazon, along with the February Case-Shiller home price index and the Conference Board’s April consumer confidence index. Wednesday brings 1Q results from eBay, ConocoPhillips, Credit Suisse, General Dynamics, Starbucks, BP, Boeing and Allstate, plus a Fed rate decision and a report on March durable goods orders. Thursday gives us earnings from PepsiCo, P&G, Motorola, Exxon Mobil, Microsoft, Sprint Nextel, Bristol Myers, Viacom and Occidental Petroleum, plus February pending home sales and weekly jobless claims data. What does Friday bring? The March consumer spending report and the University of Michigan’s final March consumer sentiment poll, plus 1Q results from Merck, Caterpillar, Chevron, Weyerhaeuser and DR Horton.


WEEKLY QUOTE
“Don't let what you cannot do interfere with what you can do.”
– John Wooden

WEEKLY TIP
If you’re getting married, inform your partner about all of your debt before the wedding day. Discussing it the day of the wedding or on the honeymoon can kill the mood. Learning about credit and debt issues after the knot is tied can lead to much frustration.

Best Regards,

Kevin Kroskey, CFP, MBA

Bookmark and Share
Citations.
1 - blogs.wsj.com/marketbeat/2011/04/20/existing-home-sales-rise-market-cheers/ [4/20/11]
2 - reuters.com/article/2011/04/21/us-markets-global-idUSTRE71H0EB20110421 [4/21/11]
3 - cnbc.com [4/22/11]
4 - bloomberg.com/news/print/2011-04-21/index-of-leading-economic-indicators-in-the-u-s-rises-0-4-.html [4/21/11]
5 - marketwatch.com/story/sp-cuts-us-rating-outlook-to-negative-2011-04-18 [4/18/11]
6 - cnbc.com/id/42708009 [4/22/11]
7 - bigcharts.marketwatch.com/historical/default.asp?symb=DJIA&closeDate=4%2F22%2F10&x=0&y=0 [4/22/11]
7 - bigcharts.marketwatch.com/historical/default.asp?symb=COMP&closeDate=4%2F22%2F10&x=10&y=18 [4/22/11]
7 - bigcharts.marketwatch.com/historical/default.asp?symb=SPX&closeDate=4%2F22%2F10&x=0&y=0 [4/22/11]
7 - bigcharts.marketwatch.com/historical/default.asp?symb=DJIA&closeDate=4%2F21%2F06&x=0&y=0 [4/22/11]
7 - bigcharts.marketwatch.com/historical/default.asp?symb=COMP&closeDate=4%2F21%2F06&x=0&y=0 [4/22/11]
7 - bigcharts.marketwatch.com/historical/default.asp?symb=SPX&closeDate=4%2F21%2F06&x=0&y=0 [4/22/11]
7 - bigcharts.marketwatch.com/historical/default.asp?symb=DJIA&closeDate=4%2F23%2F01&x=0&y=0 [4/22/11]
7 - bigcharts.marketwatch.com/historical/default.asp?symb=COMP&closeDate=4%2F23%2F01&x=0&y=0 [4/22/11]
7 - bigcharts.marketwatch.com/historical/default.asp?symb=SPX&closeDate=4%2F23%2F01&x=0&y=0 [4/22/11]
8 - treasury.gov/resource-center/data-chart-center/interest-rates/Pages/TextView.aspx?data=realyield [4/22/11]
9 - treasury.gov/resource-center/data-chart-center/interest-rates/Pages/TextView.aspx?data=realyieldAll [4/22/11]
10 - treasurydirect.gov/instit/annceresult/press/preanre/2001/ofm11001.pdf [1/10/01]
11 -montoyaregistry.com/Financial-Market.aspx?financial-market=who-needs-wealth-management-services&category=4 [4/24/11]

This material was prepared by Peter Montoya Inc., and does not necessarily represent the views of the presenting party, nor their affiliates. This information should not be construed as investment, tax or legal advice. The Dow Jones Industrial Average is a price-weighted index of 30 actively traded blue-chip stocks. The NASDAQ Composite Index is an unmanaged, market-weighted index of all over-the-counter common stocks traded on the National Association of Securities Dealers Automated Quotation System. The Standard & Poor's 500 (S&P 500) is an unmanaged group of securities considered to be representative of the stock market in general. It is not possible to invest directly in an index. NYSE Group, Inc. (NYSE:NYX) operates two securities exchanges: the New York Stock Exchange (the “NYSE”) and NYSE Arca (formerly known as the Archipelago Exchange, or ArcaEx®, and the Pacific Exchange). NYSE Group is a leading provider of securities listing, trading and market data products and services. The New York Mercantile Exchange, Inc. (NYMEX) is the world's largest physical commodity futures exchange and the preeminent trading forum for energy and precious metals, with trading conducted through two divisions – the NYMEX Division, home to the energy, platinum, and palladium markets, and the COMEX Division, on which all other metals trade. Additional risks are associated with international investing, such as currency fluctuations, political and economic instability and differences in accounting standards. All information is believed to be from reliable sources; however we make no representation as to its completeness or accuracy. All economic and performance data is historical and not indicative of future results. Market indices discussed are unmanaged. Investors cannot invest in unmanaged indices. The publisher is not engaged in rendering legal, accounting or other professional services. If assistance is needed, the reader is advised to engage the services of a competent professional.


April 11, 2011 Weekly Market Commentary

WALL STREET WATCHES BUDGET FIGHT
While journalists and political analysts worldwide pondered the effects of a federal government shutdown last week, Wall Street conducted business as usual. Any prolonged shutdown would test the stock market: while the Federal Reserve would not be forced into a hiatus, the majority of Treasury Department employees would be furloughed, and the Securities and Exchange Commission, Federal Trade Commission and Department of Justice could halt review of M&As, IPOs and new stock and bond issues. Still, much of the Street’s attention will be focused on the new earnings season this week. (For the record, stocks actually advanced about 5% during the three-week federal budget impasse of 1995-1996.)1,2,3

ISM SERVICE SECTOR INDEX DESCENDS TO 57.3
The Institute for Supply Management’s February non-manufacturing index came in at 59.7; the March edition is 2.4% lower, and ISM’s survey estimated a 7.2% decline in business activity/production for the month and a 4.0% increase in the backlog of orders. However, the ISM non-manufacturing index has shown sector expansion for 16 months.4

REMARKABLE GAINS FOR CRUDE & GOLD
Oil prices rose 4.49% last week, and they have soared 11.60% in the last three weeks. NYMEX crude ended the week at $112.79 a barrel. (The American Automobile Association said the price of a gallon of regular unleaded gas averaged $3.73 nationally as of Friday.) Gold advanced $45.30 last week to settle at $1,473.40 on the COMEX.5,6

A FLAT LANDSCAPE FOR STOCKS
The Dow, NASDAQ and S&P 500 didn’t move much between Monday and Friday. Here is how things went for the week: DJIA, +0.03% to 12,380.05; S&P 500, -0.32% to 1,328.17; NASDAQ, -0.33% to 2,780.41.7

THIS WEEK: Monday, a fresh earnings season begins with 1Q results from Alcoa. Tuesday (assuming no federal shutdown), we have data on March import and export prices. On the schedule for Wednesday, we have the Commerce Department report on March retail sales and a new Beige Book from the Federal Reserve – and before the bell, earnings from JPMorgan. Scheduled for Thursday, we have the weekly initial and continuing claims data, the March PPI and 1Q results from Google and Hasbro. The March CPI, the initial University of Michigan March consumer sentiment survey and a report on March industrial output are all slated for Friday, and that day starts with 1Q results from Bank of America and Mattel.


WEEKLY QUOTE
“Don't forget to love yourself.” – Soren Kierkegaard

Best Regards,

Kevin Kroskey


Bookmark and Share


Citations.
1 - cnbc.com/id/42478476/ [4/7/11]
2 - blogs.wsj.com/marketbeat/ [4/8/11]
3 - money.cnn.com/2011/04/08/markets/thebuzz/index.htm [4/8/11]
4 - ism.ws/ISMReport/nonmfgROB.cfm [4/5/11]
5 - blogs.wsj.com/marketbeat/2011/04/08/data-points-energy-metals-483/ [4/8/11]
6 - charlotteobserver.com/2011/04/08/2208080/gas-prices-are-on-rise-again.html [4/8/11]
7 - cnbc.com/id/42498783 [4/8/11]
8 - bigcharts.marketwatch.com/historical/default.asp?symb=DJIA&closeDate=4%2F8%2F10&x=0&y=0 [4/8/11]
8 - bigcharts.marketwatch.com/historical/default.asp?symb=COMP&closeDate=4%2F8%2F10&x=10&y=18 [4/8/11]
8 - bigcharts.marketwatch.com/historical/default.asp?symb=SPX&closeDate=4%2F8%2F10&x=0&y=0 [4/8/11]
8 - bigcharts.marketwatch.com/historical/default.asp?symb=DJIA&closeDate=4%2F7%2F06&x=0&y=0 [4/8/11]
8 - bigcharts.marketwatch.com/historical/default.asp?symb=COMP&closeDate=4%2F7%2F06&x=0&y=0 [4/8/11]
8 - bigcharts.marketwatch.com/historical/default.asp?symb=SPX&closeDate=4%2F7%2F06&x=0&y=0 [4/8/11]
8 - bigcharts.marketwatch.com/historical/default.asp?symb=DJIA&closeDate=4%2F9%2F01&x=0&y=0 [4/8/11]
8 - bigcharts.marketwatch.com/historical/default.asp?symb=COMP&closeDate=4%2F9%2F01&x=0&y=0 [4/8/11]
8 - bigcharts.marketwatch.com/historical/default.asp?symb=SPX&closeDate=4%2F9%2F01&x=0&y=0 [4/8/11]
9 - treasury.gov/resource-center/data-chart-center/interest-rates/Pages/TextView.aspx?data=realyield [4/8/11]
9 - treasury.gov/resource-center/data-chart-center/interest-rates/Pages/TextView.aspx?data=realyieldAll [4/8/11]
10 - treasurydirect.gov/instit/annceresult/press/preanre/2001/ofm11001.pdf [1/10/01]
11 - montoyaregistry.com/Financial-Market.aspx?financial-market=401k-an-overview&category=2 [4/9/11]

This material was prepared by Peter Montoya Inc., and does not necessarily represent the views of the presenting party, nor their affiliates. This information should not be construed as investment, tax or legal advice. The Dow Jones Industrial Average is a price-weighted index of 30 actively traded blue-chip stocks. The NASDAQ Composite Index is an unmanaged, market-weighted index of all over-the-counter common stocks traded on the National Association of Securities Dealers Automated Quotation System. The Standard & Poor's 500 (S&P 500) is an unmanaged group of securities considered to be representative of the stock market in general. It is not possible to invest directly in an index. NYSE Group, Inc. (NYSE:NYX) operates two securities exchanges: the New York Stock Exchange (the “NYSE”) and NYSE Arca (formerly known as the Archipelago Exchange, or ArcaEx®, and the Pacific Exchange). NYSE Group is a leading provider of securities listing, trading and market data products and services. The New York Mercantile Exchange, Inc. (NYMEX) is the world's largest physical commodity futures exchange and the preeminent trading forum for energy and precious metals, with trading conducted through two divisions – the NYMEX Division, home to the energy, platinum, and palladium markets, and the COMEX Division, on which all other metals trade. Additional risks are associated with international investing, such as currency fluctuations, political and economic instability and differences in accounting standards. All information is believed to be from reliable sources; however we make no representation as to its completeness or accuracy. All economic and performance data is historical and not indicative of future results. Market indices discussed are unmanaged. Investors cannot invest in unmanaged indices. The publisher is not engaged in rendering legal, accounting or other professional services. If assistance is needed, the reader is advised to engage the services of a competent professional.

March 28, 2011 Weekly Market Commentary

4Q GDP REVISED UPWARD
The Commerce Department’s final estimate of 4Q 2010 GDP is +3.1%, an improvement from the previous estimate of +2.8%. The revision reflects increased consumer spending, exports and business investment during the quarter – and with this alteration, the Bureau of Economic Analysis now puts U.S. GDP at +2.9% for 2010. Compare that to the -2.6% economic output of 2009.1

WHEN DOES THE REAL ESTATE RECOVERY BEGIN?
By the looks of February’s home sales figures, recovery may not begin for a while. New home sales slipped 16.9% last month according to the Census Bureau, and were 28.0% under year-ago levels. The National Association of Realtors said existing home sales fell by 9.6% last month; the median sales price for a single-family home was $157,000 (-5.2% from a year ago) with distressed homes making up 39% of the market (up 4% from a year ago). While monthly home sales figures are often later readjusted and have a sizable margin of error, the numbers are still troubling; for example, existing home sales were up for each of the preceding three months.2,3

GLOBAL UNCERTAINTY WEIGHS ON CONSUMERS
High gas prices and the unresolved nuclear power plant crisis in Japan likely impacted the University of Michigan’s final March consumer sentiment survey. The final March number was 67.5, the poorest reading the index has registered since November 2009.4

HARD GOODS ORDERS SLIP IN FEBRUARY
Durable goods orders confounded the forecasts of economists, diminishing last month by 0.9%. Minus transportation orders, the decline was 0.6%.5

STOCKS PROVE RESILIENT
While the three major Wall Street indexes are still negative for March, they all posted gains last week: DJIA, +3.05% to 12,220.59; S&P 500, +2.70% to 1,313.80; NASDAQ, +3.76% to 2,743.06. The Russell 2000 was up 3.67% last week and the “fear index”, the CBOE VIX, fell 26.72%.6

THIS WEEK: February consumer spending and January pending home sales reports arrive Monday. The Conference Board’s March consumer confidence index and the January Case-Shiller home price index come out Tuesday, plus earnings from Lennar. Thursday, we have initial and continuing claims and a report on February factory orders. Both the March unemployment report and the March ISM manufacturing report will be released on Friday.


WEEKLY QUOTE
“I have friends in overalls whose friendship I would not swap for the favor of the kings of the world.”
– Thomas Edison

WEEKLY TIP
Do you save a regular amount per month? Those who do find they have money for an emergency fund or other objectives. As you look at your monthly budget, determine the amount you can save each month and pay yourself first. Increasing your employer retirement plan contributions, takes the money out of your hands before you get it.

Best Regards,

Kevin Kroskey

Bookmark and Share


Citations.
1 - latimesblogs.latimes.com/money_co/2011/03/economic-growth-gdp-fourth-quarter-commerce-department-.html [3/25/11]
2 - census.gov/const/newressales.pdf [3/23/11]
3 - realtor.org/press_room/news_releases/2011/03/feb_decline [3/21/11]
4 - economy.kansascity.com/?q=node/10253 [3/25/11]
5 - community.nasdaq.com/News/2011-03/us-durable-good-orders-decline-in-feb.aspx [3/24/11]
6 - cnbc.com/id/42273638
7 - bigcharts.marketwatch.com/historical/default.asp?symb=DJIA&closeDate=3%2F25%2F10&x=0&y=0 [3/25/11]
7 - bigcharts.marketwatch.com/historical/default.asp?symb=COMP&closeDate=3%2F25%2F10&x=10&y=18 [3/25/11]
7 - bigcharts.marketwatch.com/historical/default.asp?symb=SPX&closeDate=3%2F25%2F10&x=0&y=0 [3/25/11]
7 - bigcharts.marketwatch.com/historical/default.asp?symb=DJIA&closeDate=3%2F24%2F06&x=0&y=0 [3/25/11]
7 - bigcharts.marketwatch.com/historical/default.asp?symb=COMP&closeDate=3%2F24%2F06&x=0&y=0 [3/25/11]
7 - bigcharts.marketwatch.com/historical/default.asp?symb=SPX&closeDate=3%2F24%2F06&x=0&y=0 [3/25/11]
7 - bigcharts.marketwatch.com/historical/default.asp?symb=DJIA&closeDate=3%2F26%2F01&x=0&y=0 [3/25/11]
7 - bigcharts.marketwatch.com/historical/default.asp?symb=COMP&closeDate=3%2F26%2F01&x=0&y=0 [3/25/11]
7 - bigcharts.marketwatch.com/historical/default.asp?symb=SPX&closeDate=3%2F26%2F01&x=0&y=0 [3/25/11]
8 - treasury.gov/resource-center/data-chart-center/interest-rates/Pages/TextView.aspx?data=realyield [3/25/11]
8 - treasury.gov/resource-center/data-chart-center/interest-rates/Pages/TextView.aspx?data=realyieldAll [3/25/11]
9 - treasurydirect.gov/instit/annceresult/press/preanre/2001/ofm11001.pdf [1/10/01]
10 - http://montoyaregistry.com/Financial-Market.aspx?financial-market=an-introduction-to-the-stock-market&category=29 [3/27/11]

This material was prepared by Peter Montoya Inc., and does not necessarily represent the views of the presenting party, nor their affiliates. This information should not be construed as investment, tax or legal advice. The Dow Jones Industrial Average is a price-weighted index of 30 actively traded blue-chip stocks. The NASDAQ Composite Index is an unmanaged, market-weighted index of all over-the-counter common stocks traded on the National Association of Securities Dealers Automated Quotation System. The Standard & Poor's 500 (S&P 500) is an unmanaged group of securities considered to be representative of the stock market in general. It is not possible to invest directly in an index. NYSE Group, Inc. (NYSE:NYX) operates two securities exchanges: the New York Stock Exchange (the “NYSE”) and NYSE Arca (formerly known as the Archipelago Exchange, or ArcaEx®, and the Pacific Exchange). NYSE Group is a leading provider of securities listing, trading and market data products and services. The New York Mercantile Exchange, Inc. (NYMEX) is the world's largest physical commodity futures exchange and the preeminent trading forum for energy and precious metals, with trading conducted through two divisions – the NYMEX Division, home to the energy, platinum, and palladium markets, and the COMEX Division, on which all other metals trade. Additional risks are associated with international investing, such as currency fluctuations, political and economic instability and differences in accounting standards. All information is believed to be from reliable sources; however we make no representation as to its completeness or accuracy. All economic and performance data is historical and not indicative of future results. Market indices discussed are unmanaged. Investors cannot invest in unmanaged indices. The publisher is not engaged in rendering legal, accounting or other professional services. If assistance is needed, the reader is advised to engage the services of a competent professional.

March 14, 2011 Weekly Market Commentary

BEST RETAIL SALES NUMBERS IN 4 MONTHS
The Census Bureau says that retail sales climbed 1.0% in February. That matched the median forecast of economists polled by Bloomberg News. Department store sales improved by 1.0% last month and restaurant sales improved by 1.2% (the best monthly gain in that category in a year). Auto sales saw a 2.3% gain in February. Overall U.S. retail sales were up 8.9% from a year before.1,2

LOWEST CONSUMER SENTIMENT IN 5 MONTHS
Sometimes economic releases seem completely contradictory. While retail sales have improved, consumer sentiment has dipped – at least according to the University of Michigan’s initial March survey, which came in at 68.2, way below the final February mark of 77.5. Soaring gas prices would seem to be a factor. The index had been making progress back toward its 2002-2007 average reading of 89.3

ROUGH GOING FOR OIL & GOLD FUTURES
Last week’s run from risk sent the prices of these commodities downward. Oil futures settled at $101.16 a barrel Friday – that was a 3.12% week-over-week drop. The decrease reflected concern over reduction of refinery capacity and demand in Japan, one of the world’s leading oil importers. As for gold, it had its poorest week since mid-January, with prices slipping $6.70 on the COMEX over five days – a 0.47% weekly loss. Gold settled at $1,421.50 Friday as its five-week winning streak was snapped.4

DOW HOLDS ON TO 12,000
In light of last week’s momentous seismic and political events, the ups and downs of Wall Street seem relatively trivial. Somehow, the Dow, S&P 500 and NASDAQ managed to remain above the psychologically significant 12,000, 1,300 and 2,700 benchmarks Friday. For the week, they performed as follows: DJIA, -1.03% to 12,044.40; NASDAQ, -2.48% to 2,715.61; S&P 500, -1.28% to 1,304.27. The CBOE VIX gained 6.56% last week.5

THIS WEEK: No major economic releases are scheduled for Monday. Tuesday, there is an FOMC meeting at the Federal Reserve. Wednesday, we learn what happened with producer prices in February, and get data about February building permits and housing starts. Thursday brings the February edition of the Consumer Price Index and the Conference Board’s February leading indicator index, plus new initial and continuing claims data and a report on February industrial output. Also in the mix Thursday: before-the-bell earnings from FedEx and after-the-bell earnings from Nike. No major economic releases are scheduled for Friday.

WEEKLY QUOTE
“Life is the art of drawing without an eraser.”
– John Gardner

WEEKLY TIP
Try setting a specific dollar amount as a goal for your emergency savings, rather than just contributing to it here and there as it's convenient. A solid goal may help you stick with steady, ongoing contributions.

Best Regards,
 
Kevin Kroskey

Bookmark and Share


Citations.
1 – dailyfinance.com/story/the-fed-economy-grew-at-a-modest-pace-in-september/19681630/ [10/20/10]
2 – msnbc.msn.com/id/39777205/ns/business-eye_on_the_economy/ [10/21/10]
3 – marketwatch.com/story/housing-starts-rise-03-to-610000-in-september-2010-10-19 [10/19/10]
4 - thestreet.com/story/10891354/1/industrial-production-drops-in-september.html [10/18/10]
5 - blogs.wsj.com/marketbeat/2010/10/22/data-points-energy-metals-386/ [10/22/10]
6 – cnbc.com/id/39801554 [10/22/10]
7 - bigcharts.marketwatch.com/historical/default.asp?detect=1&symbol=DJIA&close_date=10%2F22%2F09&x=0&y=0 [10/22/10]
7 - bigcharts.marketwatch.com/historical/default.asp?detect=1&symbol=COMP&close_date=10%2F22%2F09&x=0&y=0 [10/22/10]
7 - bigcharts.marketwatch.com/historical/default.asp?detect=1&symbol=SPX&close_date=10%2F22%2F09&x=0&y=0 [10/22/10]
7 - bigcharts.marketwatch.com/historical/default.asp?detect=1&symbol=DJIA&close_date=10%2F21%2F05&x=0&y=0 [10/22/10]
7 - bigcharts.marketwatch.com/historical/default.asp?detect=1&symbol=COMP&close_date=10%2F21%2F05&x=0&y=0 [10/22/10]
7 - bigcharts.marketwatch.com/historical/default.asp?detect=1&symbol=SPX&close_date=10%2F21%2F05&x=0&y=0 [10/22/10]
7 - bigcharts.marketwatch.com/historical/default.asp?detect=1&symbol=DJIA&close_date=10%2F23%2F00&x=0&y=0 [10/22/10]
7 - bigcharts.marketwatch.com/historical/default.asp?detect=1&symbol=COMP&close_date=10%2F23%2F00&x=0&y=0 [10/22/10]
7 - bigcharts.marketwatch.com/historical/default.asp?detect=1&symbol=SPX&close_date=10%2F23%2F00&x=0&y=0 [10/22/10]
8 - ustreas.gov/offices/domestic-finance/debt-management/interest-rate/real_yield.shtml [10/22/10]
8 - ustreas.gov/offices/domestic-finance/debt-management/interest-rate/real_yield_historical.shtml [10/22/10]
9 - treasurydirect.gov/instit/annceresult/press/preanre/2000/ofm11200.pdf [7/12/00]


This material was prepared by Peter Montoya Inc., and does not necessarily represent the views of the presenting Representative or the Representative’s Broker/Dealer. This information should not be construed as investment advice. The Dow Jones Industrial Average is a price-weighted index of 30 actively traded blue-chip stocks. The NASDAQ Composite Index is an unmanaged, market-weighted index of all over-the-counter common stocks traded on the National Association of Securities Dealers Automated Quotation System. The Standard & Poor's 500 (S&P 500) is an unmanaged group of securities considered to be representative of the stock market in general. It is not possible to invest directly in an index. NYSE Group, Inc. (NYSE:NYX) operates two securities exchanges: the New York Stock Exchange (the “NYSE”) and NYSE Arca (formerly known as the Archipelago Exchange, or ArcaEx®, and the Pacific Exchange). NYSE Group is a leading provider of securities listing, trading and market data products and services. The New York Mercantile Exchange, Inc. (NYMEX) is the world's largest physical commodity futures exchange and the preeminent trading forum for energy and precious metals, with trading conducted through two divisions – the NYMEX Division, home to the energy, platinum, and palladium markets, and the COMEX Division, on which all other metals trade. All information is believed to be from reliable sources; however we make no representation as to its completeness or accuracy. All economic and performance data is historical and not indicative of future results. Market indices discussed are unmanaged. Investors cannot invest in unmanaged indices. The publisher is not engaged in rendering legal, accounting or other professional services. If other expert assistance is needed, the reader is advised to engage the services of a competent professional. Please consult your Financial Advisor for further information. Additional risks are associated with international investing, such as currency fluctuations, political and economic instability and differences in accounting standards.

February 28, 2011 Weekly Market Commentary

STRIKING IMPROVEMENT IN CONSUMER SENTIMENT
Consumer sentiment is really rebounding – at least by the measure of the country’s two most respected polls. The final February Thomson Reuters/University of Michigan consumer sentiment survey came in at 77.5, leaping north from January’s 74.2 mark to the highest reading in 37 months. The Conference Board’s consumer confidence index climbed all the way to 70.4 this month (it was at 64.8 in January) and its gauge of future expectations hit its most optimistic level since December 2006.1,2

REAL ESTATE MARKET WEATHERS CHILLY JANUARY
According to the Census Bureau, new home sales slipped 12.6% last month. Yet the National Association of Realtors reported that residential resales improved by 2.7% in January, the fifth increase in the past six months. Existing homes have apparently become a bit less expensive: the December Case-Shiller home price index came out last week and showed prices slipping 1.0% from November across 20 metro areas.2,3

DURABLE GOODS ORDERS UP 2.7%
Aircraft orders drove the overall increase in the category for January. Economists polled by Dow Jones Newswires had forecast a 2.0% gain. Yet when you factor out transportation orders, durable goods orders actually fell 3.6% in January.4

CRUDE SETTLES NEAR $98, GAS PRICES SPIKE NORTH
By Friday afternoon, oil prices had retreated from Thursday’s $103 intraday peak. On the NYMEX, crude for April delivery settled at $97.88 a barrel Friday, capping a 9.11% weekly advance. Retail gasoline prices rose 5.9 cents overnight; the average price for a gallon of regular unleaded was $3.29 on Friday.5,6

UNREST HAMPERS STOCKS
February 21-25 amounted to the worst trading week for the S&P 500 and Dow since November. Statistically, this is what happened last week: DJIA, -2.10% to 12,130.45; NASDAQ, -1.87% to 2,781.05; S&P 500, -1.72% to 1,319.88.7

THIS WEEK: Reports on January consumer spending and December pending home sales arrive Monday. Tuesday, we get the latest ISM manufacturing index and Federal Reserve chairman Ben Bernanke speaks to Congress on monetary policy. Wednesday, we have a new Beige Book from the Fed and 4Q results from Staples and Costco. Thursday, we have the February ISM service-sector index, new initial and continuing claims figures and 4Q earnings from Kroger and Heinz. Friday, we get the February unemployment figures and the January report on factory orders.

WEEKLY QUOTE
"It is not the position, but the disposition.”
– Susan Sontag

WEEKLY TIP
Establish a timeline for your financial goals. List what you want to achieve and when, and review your progress and the deadlines you have set semi-annually or annually.

Best Regards,
 
Kevin Kroskey

Bookmark and Share

Citations.
1 - marketwatch.com/story/consumer-sentiment-rises-in-february-2011-02-25 [2/25/11]
2 - blogs.barrons.com/stockstowatchtoday/2011/02/22/consumer-confidence-up-home-prices-down/ [2/22/11]
3 - marketwatch.com/story/new-home-sales-fall-126-in-january-2011-02-24 [2/24/11]
4 - blogs.barrons.com/stockstowatchtoday/2011/02/24/jobless-claims-fall-durable-goods-orders-gain/ [2/24/11]
5 - blogs.wsj.com/marketbeat/2011/02/25/data-points-energy-metals-464/ [2/25/11]
6 - money.cnn.com/2011/02/25/news/economy/gasoline_prices/index.htm [2/25/11]
7 - cnbc.com/id/41785394 [2/25/11]
8 - bigcharts.marketwatch.com/historical/default.asp?detect=1&symbol=DJIA&close_date=2%2F25%2F10&x=0&y=0 [2/25/11]
8 - bigcharts.marketwatch.com/historical/default.asp?detect=1&symbol=COMP&close_date=2%2F25%2F10&x=0&y=0 [2/25/11]
8 - bigcharts.marketwatch.com/historical/default.asp?detect=1&symbol=SPX&close_date=2%2F25%2F10&x=0&y=0 [2/25/11]
8 - bigcharts.marketwatch.com/historical/default.asp?detect=1&symbol=DJIA&close_date=2%2F24%2F06&x=0&y=0 [2/25/11]
8 - bigcharts.marketwatch.com/historical/default.asp?detect=1&symbol=COMP&close_date=2%2F24%2F06&x=0&y=0 [2/25/11]
8 - bigcharts.marketwatch.com/historical/default.asp?detect=1&symbol=SPX&close_date=2%2F24%2F06&x=0&y=0 [2/25/11]
8 - bigcharts.marketwatch.com/historical/default.asp?detect=1&symbol=DJIA&close_date=2%2F26%2F01&x=0&y=0 [2/25/11]
8 - bigcharts.marketwatch.com/historical/default.asp?detect=1&symbol=COMP&close_date=2%2F26%2F01&x=0&y=0 [2/25/11]
8 - bigcharts.marketwatch.com/historical/default.asp?detect=1&symbol=SPX&close_date=2%2F26%2F01&x=0&y=0 [2/25/11]
9 - treasury.gov/resource-center/data-chart-center/interest-rates/Pages/TextView.aspx?data=realyield [2/25/11]
9 - treasury.gov/resource-center/data-chart-center/interest-rates/Pages/TextView.aspx?data=realyieldAll [2/25/11]
10 - treasurydirect.gov/instit/annceresult/press/preanre/2001/ofm11001.pdf [1/10/01]
11 -montoyaregistry.com/Financial-Market.aspx?financial-market=why-choose-an-independent-financial-advisor&category=5 [2/27/11]


This material was prepared by Peter Montoya Inc., and does not necessarily represent the views of the presenting party, nor their affiliates. This information should not be construed as investment, tax or legal advice. The Dow Jones Industrial Average is a price-weighted index of 30 actively traded blue-chip stocks. The NASDAQ Composite Index is an unmanaged, market-weighted index of all over-the-counter common stocks traded on the National Association of Securities Dealers Automated Quotation System. The Standard & Poor's 500 (S&P 500) is an unmanaged group of securities considered to be representative of the stock market in general. It is not possible to invest directly in an index. NYSE Group, Inc. (NYSE:NYX) operates two securities exchanges: the New York Stock Exchange (the “NYSE”) and NYSE Arca (formerly known as the Archipelago Exchange, or ArcaEx®, and the Pacific Exchange). NYSE Group is a leading provider of securities listing, trading and market data products and services. The New York Mercantile Exchange, Inc. (NYMEX) is the world's largest physical commodity futures exchange and the preeminent trading forum for energy and precious metals, with trading conducted through two divisions – the NYMEX Division, home to the energy, platinum, and palladium markets, and the COMEX Division, on which all other metals trade. Additional risks are associated with international investing, such as currency fluctuations, political and economic instability and differences in accounting standards. All information is believed to be from reliable sources; however we make no representation as to its completeness or accuracy. All economic and performance data is historical and not indicative of future results. Market indices discussed are unmanaged. Investors cannot invest in unmanaged indices. The publisher is not engaged in rendering legal, accounting or other professional services. If assistance is needed, the reader is advised to engage the services of a competent professional.

February 14, 2011 Weekly Market Commentary

AN END IN SIGHT FOR FANNIE & FREDDIE
Friday, the Obama administration presented a plan to wind down Fannie Mae and Freddie Mac by 2018, with Treasury Secretary Timothy Geithner citing “very broad consensus” that the government should play “a much smaller role” in the housing market. So what will replace them? The plan puts three options before Congress. In one option, the government would leave the mortgage market save for the VHA, FHA and other existing agencies. Two other options would set up “re-insurance” programs. A limited version would guarantee private mortgages only in economic or real estate downturns; another would provide a backstop for mortgage investments already guaranteed by private insurers. All three options would pave the way for higher mortgage costs. The Treasury and HUD have also suggested phasing in a short-term requirement for borrowers as Fannie and Freddie are unwound: homebuyers would have to put 10% down for any mortgage backed by the GSEs.1,2

CONSUMERS FEEL MORE UPBEAT
The latest Reuters/University of Michigan consumer sentiment survey is in, and the initial February reading is 75.1, an improvement from the final January mark of 74.2. This is the best reading since June 2009. The survey’s current conditions index rose 5.0% to 86.8 – the highest it has been in 37 months.3

GOLD ADVANCES, OIL PULLS BACK
Gold prices climbed 0.86% last week to settle at $1,359.90 an ounce Friday – it was the best week for the precious metal YTD. Oil and natural gas prices fell to their lowest levels since November on Friday after Egyptian president Hosni Mubarak announced his resignation; natural gas futures fell 9.28% on the week, and oil slipped 3.88% for the week to settle at $85.58 per barrel on the NYMEX.4

DJIA CLOSES AT HIGHEST MARK SINCE 6/16/08
The Dow logged an eight-day winning streak from January 31 to February 9, and it has advanced in 10 of the past 11 weeks. The weekly performance? DJIA, +1.50% to 12,273.26; NASDAQ, +1.45% to 2,809.44; S&P 500, +1.39% to 1,329.15.5

THIS WEEK: Very little is scheduled for either Monday or Friday. Tuesday brings January retail sales numbers and a report on December business inventories, plus 4Q earnings from Dell, Barclays and Tesla. Wednesday offers the January Producer Price Index, the most recent FOMC minutes, reports on January housing starts and industrial output and 4Q results from Comcast and CBS. Thursday, we get the January Consumer Price Index, the Conference Board’s latest LEI, new initial claims numbers and earnings from Nordstrom.


WEEKLY QUOTE
“The spirit, the will to win, and the will to excel are the things that endure. These qualities are so much more important than the events that occur.”
– Vince Lombardi

WEEKLY TIP
Students who want to enter college this fall should complete the FAFSA early in 2011 to increase eligibility for student aid. After completing it, they should apply for scholarships as soon as possible.

Best Regards,

Kevin Kroskey

Bookmark and Share

Citations.

1 - blogs.abcnews.com/george/2011/02/the-end-of-fannie-mae-and-freddie-mac.html [2/11/11]
2 - cnbc.com/id/41529671 [2/11/11]
3 - marketwatch.com/story/us-consumer-sentiment-rises-in-february-2011-02-11 [2/11/11]
4 - blogs.wsj.com/marketbeat/2011/02/11/data-points-energy-metals-459/ [2/11/11]
5 - cnbc.com/id/41537483 [2/11/11]
6 - bigcharts.marketwatch.com/historical/default.asp?detect=1&symbol=DJIA&close_date=2%2F11%2F10&x=0&y=0 [2/11/11]
6 - bigcharts.marketwatch.com/historical/default.asp?detect=1&symbol=COMP&close_date=2%2F11%2F10&x=0&y=0 [2/11/11]
6 - bigcharts.marketwatch.com/historical/default.asp?detect=1&symbol=SPX&close_date=2%2F11%2F10&x=0&y=0 [2/11/11]
6 - bigcharts.marketwatch.com/historical/default.asp?detect=1&symbol=DJIA&close_date=2%2F10%2F06&x=0&y=0 [2/11/11]
6 - bigcharts.marketwatch.com/historical/default.asp?detect=1&symbol=COMP&close_date=2%2F10%2F06&x=0&y=0 [2/11/11]
6 - bigcharts.marketwatch.com/historical/default.asp?detect=1&symbol=SPX&close_date=2%2F10%2F06&x=0&y=0 [2/11/11]
6 - bigcharts.marketwatch.com/historical/default.asp?detect=1&symbol=DJIA&close_date=2%2F12%2F01&x=0&y=0 [2/11/11]
6 - bigcharts.marketwatch.com/historical/default.asp?detect=1&symbol=COMP&close_date=2%2F12%2F01&x=0&y=0 [2/11/11]
6 - bigcharts.marketwatch.com/historical/default.asp?detect=1&symbol=SPX&close_date=2%2F12%2F01&x=0&y=0 [2/11/11]
7 - treasury.gov/resource-center/data-chart-center/interest-rates/Pages/TextView.aspx?data=realyield [2/11/11]
7 - treasury.gov/resource-center/data-chart-center/interest-rates/Pages/TextView.aspx?data=realyieldAll [2/11/11]
8 - treasurydirect.gov/instit/annceresult/press/preanre/2001/ofm11001.pdf [1/10/01]
9 - http://montoyaregistry.com/Financial-Market.aspx?financial-market=wills-and-living-trusts&category=30 [2/13/11]


This material was prepared by Peter Montoya Inc., and does not necessarily represent the views of the presenting party, nor their affiliates. This information should not be construed as investment, tax or legal advice. The Dow Jones Industrial Average is a price-weighted index of 30 actively traded blue-chip stocks. The NASDAQ Composite Index is an unmanaged, market-weighted index of all over-the-counter common stocks traded on the National Association of Securities Dealers Automated Quotation System. The Standard & Poor's 500 (S&P 500) is an unmanaged group of securities considered to be representative of the stock market in general. It is not possible to invest directly in an index. NYSE Group, Inc. (NYSE:NYX) operates two securities exchanges: the New York Stock Exchange (the “NYSE”) and NYSE Arca (formerly known as the Archipelago Exchange, or ArcaEx®, and the Pacific Exchange). NYSE Group is a leading provider of securities listing, trading and market data products and services. The New York Mercantile Exchange, Inc. (NYMEX) is the world's largest physical commodity futures exchange and the preeminent trading forum for energy and precious metals, with trading conducted through two divisions – the NYMEX Division, home to the energy, platinum, and palladium markets, and the COMEX Division, on which all other metals trade. Additional risks are associated with international investing, such as currency fluctuations, political and economic instability and differences in accounting standards. All information is believed to be from reliable sources; however we make no representation as to its completeness or accuracy. All economic and performance data is historical and not indicative of future results. Market indices discussed are unmanaged. Investors cannot invest in unmanaged indices. The publisher is not engaged in rendering legal, accounting or other professional services. If assistance is needed, the reader is advised to engage the services of a competent professional.

Future Posts at www.TrueWealthDesign.com

Any future blog posts will be done at www.TrueWealthDesign.com . Thank you, Kevin Kroskey, CFP, MBA