Market Commentary for the Week of May 25, 2015

What's the Big Deal Now in Greece?

U.S. markets ended the week on a down note as investors struggled with weak economic data and concerns about Greek debt negotiations. However, markets were able to end the month of May in the black. For the week, the S&P 500 lost 0.88%, the Dow dropped 1.34%, and the NASDAQ fell 0.38%. 1


On Friday, we got a look at revised first-quarter gross domestic product (GDP) growth numbers, and we found out that the economy actually shrank 0.7 percent last quarter instead of growing.2 The news wasn’t unexpected, as economists knew that the economy struggled with issues like a harsh winter, a port shutdown, and a strong dollar that ate away at U.S. exports. However, it’s unwelcome because it means that the economy still hasn’t reached escape velocity and the recovery may still be fragile.

Though we don’t have data on the spring quarter yet, many economists expect a significant rebound in economic growth. We’ve seen estimates ranging from 1.0 percent to 3.2 percent, so it’s clear that there’s a lot of room for debate.3 Markets also took a hit from stalled Greek debt negotiations. Greece is currently deadlocked in talks with creditors for a new round of loans needed to service its debt and make government payments. To give you a brief bit of history: Greece was at the center of the European debt crisis after financial markets imploded in 2008.4

To ward off a sovereign debt default, which might have touched off another European crisis, Greece accepted loans from European and international lenders in 2010. In exchange for the money, Greece agreed to institute austerity measures, massive cuts to government spending, designed to bring the national debt under control.

However, the cuts were deeply unpopular with Greek citizens, and a new leftwing Greek government elected in January rose to power on a wave of anger at the effects of austerity – rampant unemployment, brain drain, and low economic growth.5

What’s the big deal now? New Greek leaders refuse to reinstate austerity measures, and their creditors don’t want to extend more loans unless they meet their economic terms. If Greece doesn’t get another infusion of cash by its next debt deadline on June 5, the country will default on debt payments, which may trigger a banking crisis and possible exit from the European Union.6 Though the long-term effects of a “Grexit” (Greek exit) can’t be predicted, investors are likely to worry that where Greece goes, other countries may follow.

If Greece fails to reach an 11th-hour deal with its creditors this week, it’s likely that European and U.S. markets would react badly to the news. Let’s hope that this latest round of brinksmanship can be resolved; as always, we’ll keep you informed. The week ahead is also filled with domestic economic data, including the May employment report, which investors hope will show that the labor market continued its upward trend after a March blip.

ECONOMIC CALENDAR:
Monday: Personal Income and Outlays, PMI Manufacturing Index, ISM Mfg. Index, Construction Spending
Tuesday: Motor Vehicle Sales, Factory Orders
Wednesday: ADP Employment Report, International Trade, ISM Non-Mfg. Index, EIA Petroleum Status Report, Beige Book
Thursday: Jobless Claims, Productivity and Costs
Friday: Employment Situation
 
HEADLINES:

Consumer sentiment beats expectations though still weak. U.S. consumers remain cautious about the current state of the economy, leading some analysts to worry about consumer spending this quarter. 7

Durable goods orders fall. Orders for long-lasting factory goods fell in April, but the underlying data indicates that business spending is slowly picking up. Excluding volatile transportation orders, orders climbed 0.5%. 8

New home sales rise more than expected in April. Sales of newly constructed single-family homes surged in April, indicating that a housing sector resurgence may be underway. Hopefully, the strengthening job market will support sales activity. 9

Pending home sales looking up. A forward-looking indicator of U.S. home purchases rose in April for the fourth straight month in a very positive sign for the housing sector. The gauge rose 14% over April 2014, the highest level since May 2006. 10
 
 
Best Regards,
 
Kevin Kroskey
 
This article adapted with permission from Platinum Advisor Marketing Strategies, LLC
 
[2] http://www.marketwatch.com/story/us-gdp-turns-negative-in-first-quarter-again-2015-05-29
[3] http://www.marketwatch.com/story/us-gdp-turns-negative-in-first-quarter-again-2015-05-29

April Monthly Market Commentary

THE MONTH IN BRIEF
U.S. stocks wavered in April but the S&P 500 ultimately finished up 0.96%. Yet international holdings outshone the U.S. and were up markedly with emerging markets racking returns of  7.69% and international developed equities 4.08%. Interest-rate sensitive markets were down for the month with global real estate losing 2.96% and fixed income losing 0.36% as interest rates went higher. (Note: there is a general inverse relationship between the movement of interest rates and the return on interest-rate sensitive markets.)


See below for a table of various index performance.

DOMESTIC ECONOMIC HEALTH
Was the economy doing well? Or not as well as commonly believed? Last month, two headlines emerged that affected investor perceptions.
 
For the first time in a year, the economy added less than 200,000 jobs in a month: payrolls grew by 126,000 in March according to the Labor Department. In addition, 69,000 hires were retrospectively subtracted from January and February hiring totals. The headline unemployment rate stayed at 5.5% in March, with “total” unemployment (the U-6 rate including the underemployed) at 10.9%.2
 
The federal government’s first estimate of Q1 GDP was just 0.1%. Analysts polled by MarketWatch had forecast 1.1% expansion. In Q4 2014, the economy grew 2.2%.3
 
Countering these news items, personal spending improved 0.4% in March while retail sales rose 0.9%. Although the Commerce Department reported no personal wage growth in March, word came that the federal government’s employer cost index rose 0.7% in Q1 (those costs include wages). Both the headline and core Consumer Price Index were up 0.2% for March.3,4
 
News of rising oil prices and reduced hiring may have impacted consumer outlooks. While the University of Michigan’s consumer sentiment index rose 2.9 points in April to a mark of 95.9, the Conference Board’s consumer confidence index fell 6.2 points to 95.2.3
        
With energy costs rising, producer prices increased 0.2% for March, as opposed to the 0.5% retreat seen in February. After going negative for four straight months, headline durable goods orders increased by 4.0% in March.4,6
 
The latest Federal Reserve policy statement acknowledged paltry Q1 growth and the disappointing March jobs report, yet Fed officials maintained their view that “economic activity will expand at a moderate pace” in the near term. In other words, an interest rate hike in mid-2015 was improbable but not impossible.7
            
GLOBAL ECONOMIC HEALTH
The odds of Greece making its upcoming €200 million payment to the International Monetary Fund seemed to lengthen, even with the IMF extending the deadline to May 6. The Syriza party announced it would stick to its commitment to fully fund Greek social welfare programs and termed the austerity measures implemented as part of the IMF bailout “crimes”. A Grexit could happen in May and the Greek economy – which has already endured the worst recession recorded in any country since the Great Depression – could sink further. As for the broad euro area, its jobless rate remained at 11.3% with consumer prices expected to be unchanged for April after a 0.1% dip for March.8,9
   
In China, securities regulators discouraged margin lending in mid-April as small investors were borrowing dangerous amounts of money to buy stocks in a runaway bull market. New rules permitted fund managers to lend shares for short-selling, and investors were allowed to short a greater number of stocks. These developments prompted a brief global selloff on April 17.10
       
HSBC’s final April factory PMI for China showed contraction at 48.9, pointing to a distinct slowdown and perhaps a need for added stimulus. Markit’s April factory PMI for the euro area declined 0.2 points from its March level to 52.0.11     
 
          
COMMODITIES MARKETS
Oil was the big story here. WTI crude ascended 25.86% during April, finishing the month at $59.63 on the NYMEX. Heating oil and unleaded gasoline saw respective gains of 15.62% and 15.60%. Additionally, April saw a 3.25% improvement in natural gas futures.13
 
      
REAL ESTATE
The housing market approached its busiest season with momentum. Existing home sales rose 6.1% for March with the annualized pace hitting an 18-month peak, the National Association of Realtors reported. Existing home prices were up 5.1% year-over-year according to NAR; the 20-city S&P/Case-Shiller home price index measured their annualized improvement at 4.2%. NAR’s pending home sales index followed its 3.6% February advance with a 1.1% gain for March.3,15
   
Three other housing indicators went negative in March, however. New home sales fell 11.4%, but they were still up 19.4% compared to a year ago. The Census Bureau also found housing starts down 2.0% in March, and building permits down 5.7%; in annualized terms, starts were down 2.5% but permits up 2.9%.16,17
    
Freddie Mac’s April 30 Primary Mortgage Market Survey found the average interest rate on a conventional home loan down just 0.01% from March 26 at 3.68%. Rates on 15-year FRMs declined 0.03% to 2.94% and rates on 5/1-year ARMs dipped 0.07% to 2.85%; rates on 1-year ARMs rose 0.03% to 2.49%.18
          
 
Best Regards,
 
Kevin Kroskey
 
This article adapted with permission from MarketingLibrary.net.

Citations.
1 - wsj.com/mdc/public/page/2_3023-monthly_gblstkidx.html [4/30/15]
2 - cleveland.com/business/index.ssf/2015/04/us_adds_only_126000_jobs_in_ma.html [4/3/15]
3 - marketwatch.com/economy-politics/calendars/economic [5/1/15]
4 - marketwatch.com/economy-politics/calendars/economic [4/17/15]
5 - instituteforsupplymanagement.org/ISMReport/NonMfgROB.cfm [4/6/15]
6 - investing.com/economic-calendar/durable-goods-orders-86 [4/24/15]
7 - marketwatch.com/story/federal-reserve-leaves-open-chance-of-june-rate-hike-2015-04-29 [4/29/15]
8 - telegraph.co.uk/finance/economics/11573909/Defiant-Greeks-hold-firm-over-bail-out-red-lines.html [5/1/15]
9 - ec.europa.eu/eurostat [5/4/15]
10 - reuters.com/article/2015/04/17/us-markets-global-idUSKBN0N801H20150417 [4/17/15]
11 - news.investors.com/investing-stock-market-today/050415-750789-stock-market-to-open-higher-monday.htm [5/4/15]
12 - msci.com/end-of-day-data-search [4/30/15]
13 - money.cnn.com/data/commodities/ [4/30/15]
14 - online.wsj.com/mdc/public/npage/2_3050.html?mod=mdc_curr_dtabnk&symb=DXY [5/1/15]
15 - nytimes.com/2015/04/23/business/economy/home-sales-jump-to-highest-level-in-18-months.html [4/23/15]
16 - forbes.com/sites/erincarlyle/2015/04/23/new-home-sales-plunge-11-4-in-march-but-are-up-nearly-20-year-over-year/ [4/23/15]
17 - tradingeconomics.com/united-states/housing-starts [4/16/15]
18 - freddiemac.com/pmms/archive.html [5/3/15]
19 - bigcharts.marketwatch.com/historical/default.asp?symb=DJIA&closeDate=4%2F30%2F14&x=0&y=0 [4/30/15]
19 - bigcharts.marketwatch.com/historical/default.asp?symb=COMP&closeDate=4%2F30%2F14&x=0&y=0 [4/30/15]
19 - bigcharts.marketwatch.com/historical/default.asp?symb=SPX&closeDate=4%2F30%2F14&x=0&y=0 [4/30/15]
19 - bigcharts.marketwatch.com/historical/default.asp?symb=DJIA&closeDate=4%2F30%2F10&x=0&y=0 [4/30/15]
19 - bigcharts.marketwatch.com/historical/default.asp?symb=COMP&closeDate=4%2F30%2F10&x=0&y=0 [4/30/15]
19 - bigcharts.marketwatch.com/historical/default.asp?symb=SPX&closeDate=4%2F30%2F10&x=0&y=0 [4/30/15]
19 - bigcharts.marketwatch.com/historical/default.asp?symb=DJIA&closeDate=4%2F29%2F05&x=0&y=0 [4/30/15]
19 - bigcharts.marketwatch.com/historical/default.asp?symb=COMP&closeDate=4%2F29%2F05&x=0&y=0 [4/30/15]
19 - bigcharts.marketwatch.com/historical/default.asp?symb=SPX&closeDate=4%2F29%2F05&x=0&y=0 [4/30/15]        
20 - treasury.gov/resource-center/data-chart-center/interest-rates/Pages/TextView.aspx?data=realyieldAll [5/2/15]
21 - tinyurl.com/kq62aqk [5/2/15]
 

2015 First Quarter Report

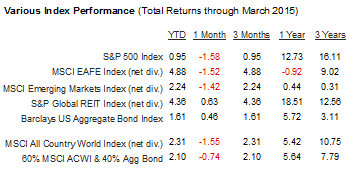
The first quarter of the new year has brought us small positive returns in many of the U.S. and global indices and more than the usual amount of anxiety along with them. See below for common market benchmark performance.
 
 
If you were watching the markets day to day, you experienced a mild roller coaster, what trading professionals refer to as a sideways market.  One day it was up, the next down, each day (or week) seeming to erase the gains or losses of the previous ones.  The best explanation for this phenomenon is that investors are still looking over their shoulders at interest rates, waiting for bond yields to jump higher, making bonds more competitive with stocks and triggering an outflow from the stock market that could (so the reasoning goes) cause a bear market in U.S. equities. 
 
However, investors have been waiting for this shoe to drop for the better part of three years, and meanwhile, interest rates have drifted decidedly lower in the first quarter.  The Bloomberg U.S. Corporate Bond Index now has an effective yield of 2.93%.  30-year Treasuries are yielding 2.48%, roughly 0.3% lower than in December, and 10-year Treasuries currently yield 1.87%, down from 2.17% at the beginning of the year. 
 
This interest rate watch has created a peculiar dynamic where up is down and down is up in terms of how traders and stock market gamblers look at the future.  The generally positive economic news is greeted with dismay (The Fed will notice and start raising rates sooner rather than later!  Boo!) and any bad news sends the stock market back up again into mild euphoria (The Fed might hold off another quarter!  Yay!). 
 
The Fed’s future actions are inscrutable.  You will hear knowledgeable Fed-watchers say that the Fed will take action as early as June or as late as next year, and none of them really know.
 
We should all welcome the Fed pullback, not fear it.  A lot of the uncertainty among traders and even long-term investors is coming from anxiety over how this experiment is going to end.  The U.S. Central bank has directly intervened in the markets and in the economy, and is still doing so.  When that ends, normal market forces will take over, and we’ll all have a better handle on what “normal” means in this economic era.  Is there great demand for credit to fuel growth?  What would rational investors pay for Treasury and corporate bonds if they weren’t bidding against an 800-pound gorilla?  Would retirees prefer an absolutely certain 4.5% return on 30-year Treasury bonds or the less certain (but historically higher) returns they can get from the stock market?  These are questions that all of us would like to know the answer to, and we won’t until all the QE interventions have ended.
 
What DO we know?  Data shows that the U.S. economy is less dependent on foreign oil than at any time since 1987, and the trend is moving toward complete independence.  Oil—and energy generally—is cheaper now than it has been in several decades, which makes our lives, and the production of goods and services, less expensive.
 
Meanwhile, more Americans are working.  Figure 3 shows that the U.S. unemployment rate—at 5.5%—is trending dramatically lower and is now reaching levels that are actually below the long-term norms.  Unemployment today is lower than the rate for much of the booming ‘90s, and is approaching the lows of the early 1970s. 
 
And real GDP—the broadest measure of economic activity in the United States—increased 2.4% last year, after rising 2.2% the previous year.   America is growing.  Not rapidly, but slow growth might not be so terrible.  Rapid economic growth has, in the past, often preceded economic recessions, where excesses had to be corrected.  Slow, steady growth may be boring, but it’s certainly not bad news for the economy or the markets.
 
It has been said that people lose far more money in opportunity costs by trying to avoid future market downturns while the markets are still going up than by holding their ground during actual downturns.  And, in fact, in every case so far, the U.S. market has eventually made up the ground it lost in every bear market we’ve experienced.  The last trading day of the quarter looked bearish, as have many other gloomy trading days during this seven year bull market.  It seems like every week, somebody else has predicted an imminent decline that has not happened.  People who listened to the alarmists lost out on solid returns.  You filter out the good news at your peril.

To Your Prosperity,

Kevin Kroskey, CFP®, MBA
  
This article adapted with permission from Bob Veres.
Sources:
Wilshire index data: http://www.wilshire.com/Indexes/calculator/
Russell index data: http://www.russell.com/indexes/data/daily_total_returns_us.asp
S&P index data: http://www.standardandpoors.com/indices/sp-500/en/us/?indexId=spusa-500-usduf--p-us-l--
http://www.tradingeconomics.com/united-states/unemployment-rate
Nasdaq index data: http://quicktake.morningstar.com/Index/IndexCharts.aspx?Symbol=COMP
International indices: http://www.mscibarra.com/products/indices/international_equity_indices/performance.html
Commodities index data: http://us.spindices.com/index-family/commodities/sp-gsci
Treasury market rates: http://www.bloomberg.com/markets/rates-bonds/government-bonds/us/
http://www.bloomberg.com/news/articles/2015-04-01/u-s-oil-imports-from-opec-have-plunged-to-a-28-year-low
Aggregate corporate bond rates: https://indices.barcap.com/show?url=Benchmark_Indices/Aggregate/Bond_Indices
Aggregate corporate bond rates: http://www.bloomberg.com/markets/rates-bonds/corporate-bonds/
http://bea.gov/newsreleases/national/gdp/gdpnewsrelease.htm


February Monthly Market Commentary

THE MONTH IN BRIEF
What a difference a month makes. After a rough January, the S&P 500 soared 5.49% in February. Steadying oil prices, solid earnings, improving indicators in Europe and Asia and central bank action all prompted the bulls to run freely. Stateside, inflation gave way to a touch of deflation, home sales cooled off and consumer spending and confidence were disappointing – but the labor market was in good shape and so were the manufacturing and service sectors. February brought some reassuring economic news, and that was all Wall Street needed for a rally.1


DOMESTIC ECONOMIC HEALTH
Cheaper fuel and energy costs meant two things: less consumer spending and falling consumer prices. Important economic indicators reflected these developments. January’s Consumer Price Index dipped 0.7% (although the core CPI rose 0.2%), resulting in annual deflation in the United States for the first time since October 2009. Personal spending lagged 0.2% during January. The federal government also reduced Q4 GDP in its second estimate, taking growth down to 2.3% from the previously announced 2.6%.2,3
 
Consumer confidence retreated, perhaps in the wake of a bad January for stocks and word that gas prices were poised to go back up. February’s Conference Board index slipped 7.4 points to 96.4; the final February University of Michigan consumer sentiment index came in at 95.4, down from 98.1 in the final January survey.2,4
   
Fortunately, there was enough good news to offset the bad. The Labor Department’s January jobs report showed 257,000 new hires. Companies were hiring at the fastest clip in 18 years – non-farm payrolls had swelled by an average of 336,000 workers a month from November-January. The unemployment rate did tick north to 5.7% in January and the underemployment (U-6) rate was up at 11.3%, but this reflected an increase in job seekers. Hourly wages were up 0.5% in January, personal incomes up 0.3%.2,5
   
America’s manufacturing sector continued to grow and expand. February’s ISM factory PMI came in at 52.9, not too far off of January’s 53.5 reading; the Federal Reserve found manufacturing output up 0.2% for that month. ISM’s service sector PMI had notched a reading of 56.7 for January, rising 0.2 points. Hard goods orders improved 2.8% in January after slipping 3.7% in December. The Producer Price Index declined 0.8% in January thanks largely to a record 10.3% monthly plunge for wholesale energy prices (January saw a seventh consecutive monthly decline).2,6
          
Fed chair Janet Yellen underlined the central bank’s commitment to patience on raising interest rates in her February testimony before the Senate banking committee, saying it seemed “unlikely that economic conditions will warrant an increase in the target range for the federal funds rate for at least the next couple of FOMC meetings.”7    
          
GLOBAL ECONOMIC HEALTH
There was no “Grexit” in February: Greece and the European Union hammered out a deal in principle to extend aid to that nation’s beleaguered economy through the end of June. (Without a deal, the €240 billion bailout for Greece would have ceased at the end of February). Greece remained on shaky ground with the EU and the International Monetary Fund, but at least it remained in the eurozone. A Eurostat flash estimate showed euro area deflation halved in February from January levels (consumer prices retreated only 0.3% annually as opposed to 0.6%). Unemployment ticked down to 11.2% in the 19-country euro area in January, a 33-month low.8,9
      
February ended with a surprise from the east: the People’s Bank of China made its second interest rate cut in three months (the benchmark rate was lowered 0.25% to 5.35%). Also, the final February HSBC/Markit China manufacturing PMI showed sector growth again at a better-than-expected 50.7 reading, up a full point in a month. February HSBC/Markit factory PMIs in other key Asia Pacific nations were all above 50 as well: 52.9 in India, 51.6 in Japan, and 51.1 in South Korea.10,11

WORLD MARKETS        
Just how good was February for stocks? You not only had all-time highs for the S&P and Dow by the end of the month, you also had historic peaks for Germany’s DAX and Great Britain’s FTSE 100 and Japan’s Nikkei 225 reaching a 15-year high.12
          
COMMODITIES MARKETS
Oil found a floor and took a step up: on the NYMEX, light sweet crude ended the month at $49.76 a barrel, going +3.32% for February. The big leap was taken by RBOB gasoline, which rose 24.43% on the month. February also saw gains of 14.74% for heating oil and 1.05% for natural gas. Cocoa futures were up 15.59% for February, corn futures 3.58%, cotton futures 7.87%, soybean futures 7.24% and wheat futures 3.59%. Last month’s losers among ag futures included coffee (-15.10%) and sugar (-5.81%).14
 
Gold retreated 4.70% to $1,213.10, silver 2.56% to $16.56. Platinum fell 3.60%. As for the U.S. Dollar Index, it wrapped up February at 95.29 (+0.52% on the month).14,15
    
REAL ESTATE
Brutal weather across two-thirds of the country held homebuying back. The Census Bureau found new home sales tailing off 0.2% in January. More significantly, the National Association of Realtors measured a 4.9% fall in existing home sales. The NAR did announce a 1.7% January gain in its pending home sales index. According to the latest S&P/Case-Shiller home price index, prices across 20 major metro areas climbed an average of 4.5% during 2014.2,16
  
Snow, sleet and ice had also slightly hindered new construction. The Census Bureau reported groundbreaking down 2.0% for January, and there were also 0.7% fewer building permits issued. Starts were still up 18.7% from a year prior, and permits were 8.1% above year-ago levels.17
   
Home loan interest rates increased in February. Freddie Mac’s February 26 Primary Mortgage Market Survey found the average interest on a 30-year FRM at 3.80%, a 15-year FRM at 3.07%, a 5/1-year ARM at 2.99% and a 1-year ARM at 2.44%. In its January 29 survey, interest averaged 3.66% for the 30-year fixed, 2.98% for the 15-year fixed, 2.86% for the 5/1-year ARM and 2.38% for the 1-year ARM.18
         
LOOKING BACK…LOOKING FORWARD
February brought a major drop for the CBOE VIX; the so-called “fear index” ended the month 36.39% lower at 13.34. The Nasdaq climbed 7.08% to 4,963.53, the Russell 2000 5.83% to 1,233.37, the Dow 5.64% to 18,132.70 and the S&P 5.49% to 2,104.50. February, in fact, was the S&P’s hottest month since October 2011.1,12
 

March opened with the Nasdaq closing above 5,000 for only the third time in history and the S&P, Russell 2000 and Dow all settling at record levels. Have headwinds suddenly ceased? No. In Europe, the restructured Greek debt deal is still a shaky one, deflation is lingering and the jobless rate is twice ours. Demand for key commodities isn’t where it was two years ago; oil prices are half what they once were. Warnings that the majority of stocks are overvalued continue, with bears maintaining that the S&P will only make a minor gain for 2015. Still, the bulls staged a remarkable return last month and March has begun with the sense that obstacles have been cleared from their path. While this bull market is growing venerable, it does not yet seem vulnerable to many investors.22

To Your Prosperity,
 
Kevin Kroskey, CFP®, MBA
 
This article adapted with permission from MarketingLibrary.net.
Citations.
1 - wsj.com/mdc/public/page/2_3023-monthly_gblstkidx.html [2/27/15]
2 - marketwatch.com/economy-politics/calendars/economic [2/27/15]
3 - tinyurl.com/pn4rvqe [2/26/15]
4 - investing.com/economic-calendar/michigan-consumer-sentiment-320 [2/27/15]
5 - marketwatch.com/story/us-adds-257000-jobs-as-wage-gains-appear-2015-02-06 [2/6/15]
6 - reuters.com/article/2015/02/18/usa-economy-idUSL1N0VS0SI20150218 [2/18/15]
7 - tinyurl.com/omzlqpe [2/24/15]
8 - irishtimes.com/business/economy/greece-eurogroup-agree-to-four-month-bailout-extension-1.2111060 [2/20/15]
9 - ec.europa.eu/eurostat [3/2/15]
10 - moneycontrol.com/news/asian-markets/chinas-rate-cut-buoys-asia-stks-yuan-at-over-two-year-low_1317789.html [3/2/15]
11 - tinyurl.com/n7sqltg [3/2/15]
12 - money.cnn.com/2015/02/27/investing/stocks-market-record-february/index.html [2/27/15]
13 - mscibarra.com/products/indices/international_equity_indices/gimi/stdindex/performance.html [2/27/15]
14 - money.cnn.com/data/commodities/ [2/27/15]
15 - online.wsj.com/mdc/public/npage/2_3050.html?mod=mdc_curr_dtabnk&symb=DXY [3/2/15]
16 - usnews.com/news/business/articles/2015/02/25/us-new-home-sales-barely-nudge-up-in-january [2/25/15]
17 - equipmentworld.com/u-s-home-starts-fall-2-percent-in-january-as-builder-confidence-dips-due-to-cold-weather/ [2/18/15]
18 - freddiemac.com/pmms/archive.html [3/2/15]
19 - bigcharts.marketwatch.com/historical/default.asp?symb=DJIA&closeDate=2%2F27%2F14&x=0&y=0 [2/27/15]
19 - bigcharts.marketwatch.com/historical/default.asp?symb=COMP&closeDate=2%2F27%2F14&x=0&y=0 [2/27/15]
19 - bigcharts.marketwatch.com/historical/default.asp?symb=SPX&closeDate=2%2F27%2F14&x=0&y=0 [2/27/15]
19 - bigcharts.marketwatch.com/historical/default.asp?symb=DJIA&closeDate=2%2F26%2F10&x=0&y=0 [2/27/15]
19 - bigcharts.marketwatch.com/historical/default.asp?symb=COMP&closeDate=2%2F26%2F10&x=0&y=0 [2/27/15]
19 - bigcharts.marketwatch.com/historical/default.asp?symb=SPX&closeDate=2%2F26%2F10&x=0&y=0 [2/27/15]
19 - bigcharts.marketwatch.com/historical/default.asp?symb=DJIA&closeDate=2%2F28%2F05&x=0&y=0 [2/27/15]
19 - bigcharts.marketwatch.com/historical/default.asp?symb=COMP&closeDate=2%2F28%2F05&x=0&y=0 [2/27/15]
19 - bigcharts.marketwatch.com/historical/default.asp?symb=SPX&closeDate=2%2F28%2F05&x=0&y=0 [2/27/15]        
20 - treasury.gov/resource-center/data-chart-center/interest-rates/Pages/TextView.aspx?data=realyield [3/2/15]
21 - treasury.gov/resource-center/data-chart-center/interest-rates/Pages/TextView.aspx?data=realyieldAll [3/2/15]
22 - marketwatch.com/story/us-stocks-futures-climb-ahead-of-data-deluge-2015-03-02/ [3/2/15]
 

Future Posts at www.TrueWealthDesign.com

Any future blog posts will be done at www.TrueWealthDesign.com . Thank you, Kevin Kroskey, CFP, MBA