It's
hard to describe single-digit first half returns as a raging bull market, but
it's also hard to feel too negative about a six month period when the S&P
500 recorded 22 record highs and virtually everything in your
portfolio--including bonds--rose in value.
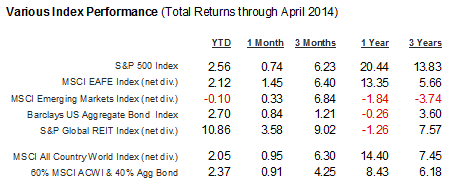
Key index performance is shown in the table below.
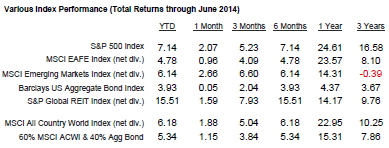
Large cap stocks, represented by the Russell 1000
large-cap index returned 5.12% for the quarter, up 7.27% for the year, while
the widely-quoted S&P 500 index of large company stocks gained 4.69% for
the quarter and is up 6.05% since January 1.
The
Russell midcap index was up 4.97% for the
quarter, and now stands at a 8.67% gain so far this year.
Small
company stocks, as measured by the Russell 2000
small-cap index was up 1.95% in the second three months of the year, posting a
3.19% gain in the year's first half. The
technology-heavy Nasdaq Composite Index was up 5.94% for the quarter, and is up
5.30% for its investors so far this year, reaching levels that haven't been
seen since March 2000.
The
rest of the world is not doing as well.
The broad-based EAFE index of larger foreign companies in developed
economies rose 2.95% in dollar terms during the second quarter of the year, and
is up the same 2.95% so far this year.
The stocks across the Eurozone economies rose 1.90%, and are now up
3.45% for the first half of the year.
Looking
over the other investment categories, real estate investments, as measured by
the Wilshire REIT index, rose 7.47% for the quarter, and is standing at a
remarkable 18.36% gain for the year. Commodities,
as measured by the S&P GSCI index, rose 2.69% this past quarter, posting a
gain of 5.71% for the year.
Most
market participants and pundits expected bond rates to rise in the first half
of the year, but once again bond returns surprised the experts. The Bloomberg U.S. Corporate Bond Index now
has an effective yield of just 2.90%, while comparable yields in the Eurozone
stand at 1.64%.
Treasury
rates took their biggest first-half drop since 2010. 30-year Treasuries have seen their yields fall
to 3.36% in the past six months, and 10-year Treasuries currently yield
2.53%. At the low end, 3-month T-bills
are still yielding a miniscule 0.04%; 6-month bills are only slightly more
generous, at 0.06%.
One
of the most interesting questions batted around among professional investors
these days is: are these low yields sustainable in the future? Can they keep dropping? Won't the appetite for Treasuries finally dry
up, forcing rates higher? If you look at
Treasury rates in isolation, current rates seem to be as low as they can
go. But it is also interesting to look
at the global bond markets from an international investor's perspective. Would you prefer to invest in U.S. 10-year
Treasuries at 2.53%, or buy comparable Japanese government bonds, yielding just
0.563%. Are you more attracted to German
10-year bunds, trading at 1.25% yields?
As little as they are yielding today, U.S. government bonds are still
pulling in buyers from around the world, both as a safe haven and as a source
of higher yields.
But
depending on where you look, the economic news has been somewhat scary. The U.S. economy's GDP dropped 2.9% in the
first quarter of the year--an enormous hit which has been largely blamed on the
weather. The uncertainty in Iraq,
including the recent ISIS capture of a major refinery, has sent the spot price
of oil above $107 a barrel on global markets.
Manufacturing activity fell in the past month, and the growth of jobs,
which looked promising last year, has slowed down, with the unemployment rate
stuck at 6.3%.
There
are also positive signs, particularly in the statistics for housing
demand. The pending home sales index for
contracts to purchase previously-owned U.S. homes rose 6.1% in May, the largest
advance since April 2010, when sales were boosted because the homebuyer's tax
credit was on the verge of expiration.
The rise in the overall REIT index suggests a strong bounceback in the
real estate industry overall.
Even
the government seems to be getting its books back in balance. You won't read about it in the newspapers,
but the U.S. federal deficit has fallen from $1.4 trillion to around $400
billion in the space of one year. And
the U.S. is now close to energy self-sufficiency, which means that the trade
deficit (which has been largely driven by the cost of importing Middle Eastern
oil) is shrinking dramatically vis a vis the rest of the world.
The
Michigan Sentiment Index recently hit 82.5, which means that people are
generally optimistic about the state of the economy and the world.
Where
do we go from here? The future is never
clear, but today it might be less clear than usual. The long bull market that started in March
2009 and the economic expansion that started nearly at the same time are both
among the longest since the Civil War.
Bull markets have to end eventually; we all know that. However, this growth period has been more
like a marathon than the usual recovery sprint after a recession; the economy
has grown at a 2% annualized rate since 2009, which is below the long-term
average, and considerably below what is normal during a recovery from economic
malaise. Marathon runners--at least in
theory--can keep moving longer than sprinters.
Is that the case today? The U.S.
Federal Reserve has vowed to keep interest rates low for the next 12 months,
and many investors seem to be comfortable with with this approach, believing it
could be a recipe for more economic growth, profits and clear stock market
sailing in the foreseeable future.
The
truth is, none of us can tell whether the markets will continue to test records
or not. The best indicator, and it is
not something you can pin down, is whether people are still anxious about the
future and concerned about the possibility of a market plunge. So long as people are still worried, the
market probably hasn't reached its top.
Whenever you see most investors finally deciding that the market is on a
permanent upward climb, whenever everybody finally gives up on worry and puts
their money into the hot market, that is when stocks have probably peaked, and
an unpleasant surprise awaits those who joined the party too late.
Where
are we on this scale? Few investors seem
to be enthusiastic about current market valuations, which some believe to be a
bit overpriced. At the same time, the
sentiment surveys are in the "complacent" zone, and we are not
hearing quite the same shrill tone from perma-bears and pundits who probably
feel a bit embarrassed about predicting disaster over and over again as the
markets sailed through scary headlines and economic headwinds.
This
may be the perfect time to celebrate the fact that we've managed to stay
invested during fearful times, when government shutdowns, European banking
crises and the threat of another meltdown at home were driving others away from
the improbable upward trend. Since 2009,
only the brave have stayed the course, and they earned the rewards of what, in
retrospect, has been one of the most generous bull markets in U.S. history. How much more is in store for them, or when
the inevitable pullback will come, is not something we mortals are given to
know--despite the loud predictions you will hear from economists and pundits
whose crystal balls are no more clear than yours.
Kevin Kroskey, CFP®, MBA
This article adapted with permission from Bob Veres.
Sources:
Wilshire
index data: http://www.wilshire.com/Indexes/calculator/
Russell
index data: http://www.russell.com/indexes/data/daily_total_returns_us.asp
S&P
index data: http://www.standardandpoors.com/indices/sp-500/en/us/?indexId=spusa-500-usduf--p-us-l--
Nasdaq
index data: http://quicktake.morningstar.com/Index/IndexCharts.aspx?Symbol=COMP
International
indices: http://www.mscibarra.com/products/indices/international_equity_indices/performance.html
Commodities
index data: http://us.spindices.com/index-family/commodities/sp-gsci
Treasury
market rates: http://www.bloomberg.com/markets/rates-bonds/government-bonds/us/
Aggregate
corporate bond rates: https://indices.barcap.com/show?url=Benchmark_Indices/Aggregate/Bond_Indices
Aggregate
corporate bond rates: http://www.bloomberg.com/markets/rates-bonds/corporate-bonds/


