THE MONTH IN BRIEF
Stocks seemed set for just a slight July loss until developments on the last day of the month rattled Wall Street. Argentina effectively defaulted on its debt (for the second time in the past 13 years), and new data out of Washington showed that wages were finally on the way up (a caution flag for higher interest rates). The blue chips lost 317 points on July 31 (the Dow’s worst day since February 3) while the S&P 500 sank 39 points. The S&P lost 1.51% in an eventful month in which the Fed set an exit plan for QE3, a pair of geopolitical events troubled global markets, and U.S. economic indicators looked pretty good even as earnings were mediocre.1,2
Stocks seemed set for just a slight July loss until developments on the last day of the month rattled Wall Street. Argentina effectively defaulted on its debt (for the second time in the past 13 years), and new data out of Washington showed that wages were finally on the way up (a caution flag for higher interest rates). The blue chips lost 317 points on July 31 (the Dow’s worst day since February 3) while the S&P 500 sank 39 points. The S&P lost 1.51% in an eventful month in which the Fed set an exit plan for QE3, a pair of geopolitical events troubled global markets, and U.S. economic indicators looked pretty good even as earnings were mediocre.1,2
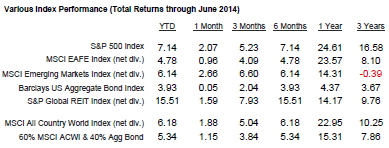
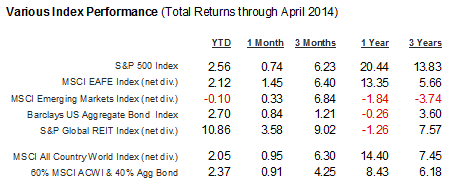
Key index performance is shown in the table below.

DOMESTIC ECONOMIC HEALTH
July’s Conference Board consumer confidence index came in at 90.9, a major leap from the (upwardly revised) June reading of 86.4. The University of Michigan’s consumer sentiment index, on the other hand, only reached 81.8 (0.7 points beneath the forecast of economists polled by Briefing.com). Consumer spending and incomes were both up 0.4% in June, and retail sales advanced another 0.2% in that month, with the Commerce Department revising May’s gain north to 0.5%.3,4
July’s Conference Board consumer confidence index came in at 90.9, a major leap from the (upwardly revised) June reading of 86.4. The University of Michigan’s consumer sentiment index, on the other hand, only reached 81.8 (0.7 points beneath the forecast of economists polled by Briefing.com). Consumer spending and incomes were both up 0.4% in June, and retail sales advanced another 0.2% in that month, with the Commerce Department revising May’s gain north to 0.5%.3,4
As
for employment, the Labor Department noted a sixth consecutive month of job
creation above the 200,000 level – something that hadn’t occurred since 1997.
Employers added 209,000 non-farm jobs in July, 47,000 in the professional &
business services category. Unemployment crept up to 6.2% and underemployment
(the U-6 rate) ticked up to 12.2% last month, but that was a consequence of
more participants in the labor market.5
On the factory front, the Institute for Supply Management’s
July manufacturing PMI read 57.1, up 1.8 points from June. U.S. industrial
output had risen 0.2% in June, a Federal Reserve report noted. Buoyed by demand
for aircraft, durable goods orders advanced 0.7% in June after a 1.0% retreat
in May.3,4,6
Annualized
consumer inflation remained at 2.1% in June, even with a 0.3% monthly rise in
the Consumer Price Index. (Yearly inflation was only at 1.1% in February.) Wholesale
prices were up 1.9% in 12 months as of June, with the Producer Price Index
showing a monthly gain of 0.4%. At month’s end, Wall Street noticed that the Bureau
of Labor Statistics employment cost index rose 0.7% in Q2, its largest
quarterly jump since 2008. Employment costs include wages, and
this signaled wage growth at last. Investors fretted that the rising indicator
might offer further grounds for hiking interest rates sooner than anticipated.7,8
On
July 9, the Fed solidified its endgame for QE3: reductions to monetary stimulus
would continue as scheduled, concluding with a last $15 billion cut to zero at
the October Federal Open Market Committee meeting. The economy was certainly
over the winter doldrums: in the federal government’s initial estimate, Q2 brought
4.0% growth. The abysmal first quarter number was revised again: Q1 2014 GDP
now goes in the books at -2.1% rather than -2.9%.3,9
GLOBAL ECONOMIC HEALTH
In 2001, Wall Street hedge fund managers bought inexpensive debt from Argentina only to see that nation stop the bond payments and record the worst sovereign default in history. As July ended, Argentina stared into the maw of a second default related to the first. U.S. district courts were blocking payments to the nation’s other bondholders until Argentina finally paid interest on the debt payments it had owed the American hedge funds for 13 years. The crisis triggered a major global selloff, but that wasn’t the only anxiety putting pressure on stock market indices in July.10
In 2001, Wall Street hedge fund managers bought inexpensive debt from Argentina only to see that nation stop the bond payments and record the worst sovereign default in history. As July ended, Argentina stared into the maw of a second default related to the first. U.S. district courts were blocking payments to the nation’s other bondholders until Argentina finally paid interest on the debt payments it had owed the American hedge funds for 13 years. The crisis triggered a major global selloff, but that wasn’t the only anxiety putting pressure on stock market indices in July.10
After
the downing of Malaysia Airlines Flight 17 in Ukraine at the apparent hands of
Russian separatists, investors worried that the U.S. and eurozone would tighten
economic sanctions on Russia. Israel launched a ground offensive into Gaza in
response to Hamas missile attacks, and attempts at cease fires were short-lived.
In mid-month, the parent firm of major Portuguese lender Banco Espirito Santo
failed to make payments on commercial paper – and the bank still appeared shaky
as July ended.1,11
China offered better news. In July, its official
PMI rose 0.7 points to a 26-month peak of 51.7. China’s GDP was 7.4% for the
first half of 2014, but its government still predicted its economy reaching the
7.5% target for the year. Markit’s eurozone PMI topped the Reuters forecast of
52.8 for July, reaching a 3-month peak of 54.0. Factory sectors in France and Germany
were heading in opposite directions – France’s Markit PMI was at 49.4 in July,
Germany’s at 55.9. Markit projections showed eurozone GDP growing at about 0.4%
per quarter.12,13
WORLD MARKETS
For the second month in a row, emerging market indices largely outpaced benchmarks in Europe and the U.S. Witness these July performances: Hang Seng, +6.75%; Kospi, +3.69%; Nikkei 225, +3.03%; Sensex, +1.89%; Jakarta Composite, +4.31%; Bovespa, +5.01%; IPC All-Share, +2.53%; Merval, +3.81%; Shanghai Composite, +7.48%; ASX 200, +4.40%; MSCI Emerging Markets, +1.43%; Asia Dow, +1.59%. (The Dow Jones Americas index did pull back 1.71%).2,14
For the second month in a row, emerging market indices largely outpaced benchmarks in Europe and the U.S. Witness these July performances: Hang Seng, +6.75%; Kospi, +3.69%; Nikkei 225, +3.03%; Sensex, +1.89%; Jakarta Composite, +4.31%; Bovespa, +5.01%; IPC All-Share, +2.53%; Merval, +3.81%; Shanghai Composite, +7.48%; ASX 200, +4.40%; MSCI Emerging Markets, +1.43%; Asia Dow, +1.59%. (The Dow Jones Americas index did pull back 1.71%).2,14
Major European indices were mostly in the
red in July. Losses came to the DAX (4.33%), the CAC 40 (4.00%), the RTS
(10.74%), the FTSE 100 (0.21%), the Europe Dow (4.05%) and the STOXX 600
(1.72%). To round out the scorecard, the MSCI World Index fell 1.67% in July,
the Global Dow 1.02%.2,14
COMMODITIES MARKETS
In the big picture, futures struggled.
Energy futures certainly didn’t have a good month: July brought losses of
14.04% for natural gas, 9.16% for unleaded gasoline, 2.68% for heating oil and
7.22% for oil, with NYMEX crude ending the month at $98.17. Some marquee crops
descended, too: cotton went -15.39% last month, soybeans -12.54%, wheat -5.97%,
sugar -0.99% and corn -15.57%. Cocoa and coffee proved exceptions; the former
gained 2.13% and the latter jumped 13.49%.15
How did key metals do? Not too well. Copper
futures rose 1.00% last month, but July saw COMEX gold lose 3.43%, silver 2.76%
and platinum 1.57%. At the close on July 31, COMEX gold was valued at $1,281.30
an ounce. The U.S. Dollar Index gained 2.11% for July.15,16
REAL ESTATE
Housing indicators presented a mixed bag as the data stream went from the prime home buying season of spring into summer. Existing home sales, according to the National Association of Realtors, rose 5.3% in June. That increase sent the yearly sales pace up to 5.04 million; October was the last month in which it was that high. New home sales plummeted 8.1% for June, and the Census Bureau noted 5.8 months of new home inventory on the market – the most since October 2011. Pending home sales were down 1.1% for June, NAR noted, a sea change from the 6.0% gain noticed in May.3,17
Housing indicators presented a mixed bag as the data stream went from the prime home buying season of spring into summer. Existing home sales, according to the National Association of Realtors, rose 5.3% in June. That increase sent the yearly sales pace up to 5.04 million; October was the last month in which it was that high. New home sales plummeted 8.1% for June, and the Census Bureau noted 5.8 months of new home inventory on the market – the most since October 2011. Pending home sales were down 1.1% for June, NAR noted, a sea change from the 6.0% gain noticed in May.3,17
As for yearly home price gains, there was a
major slip for the S&P/Case-Shiller index in May – the annualized
overall price gain across 20 metro markets was 9.3%, down markedly from 10.8%
in the April edition. The Census Bureau found a 5.3% annualized increase in new
home prices. Building permits for new construction
were down 4.2% for June, and housing starts down 9.3% in that month.3,7,17
Home loans? On July 31, Freddie Mac published the
following average interest rates in its Primary Mortgage Market Survey: 30-year
FRM, 4.12%; 15-year FRM, 3.23%; 5/1-year ARM, 3.01%; 1-year ARM, 2.38%. Here
were the average rates on June 26: 30-year FRM, 4.14%; 15-year FRM, 3.22%;
5/1-year ARM, 2.98%; 1-year ARM, 2.40%.18
LOOKING BACK…LOOKING FORWARD
At the close on July 31, the Dow settled at 16,563.30, the S&P at 1,930.67, the Nasdaq at 4,369.77 and the Russell 2000 at 1,120.07. Small caps also took a beating in July, with the RUT diving 6.11%. The jump in the CBOE VIX exceeded 30% in the last trading week of the month, which left the fear index with a July gain of 46.50%. The VIX ended July at 16.95.2,21
At the close on July 31, the Dow settled at 16,563.30, the S&P at 1,930.67, the Nasdaq at 4,369.77 and the Russell 2000 at 1,120.07. Small caps also took a beating in July, with the RUT diving 6.11%. The jump in the CBOE VIX exceeded 30% in the last trading week of the month, which left the fear index with a July gain of 46.50%. The VIX ended July at 16.95.2,21
After
the fall stocks took at the end of last month, analysts are again wondering if
a correction is near. (For the record, the July 31 selloff left the S&P 500
just 3.1% down from its record high.) If a correction is coming – and
Argentina, Russia and Portugal aren’t the only possible worries that might
unnerve Wall Street – there is always the silver lining of being able to pick
up quality shares for less, an opportunity some investors have awaited. There
is certainly more to worry about than there was three months ago. Global
investors do take many cues from the U.S., however, and our hiring and our GDP
look very, very good right now. How much attention will the (presumably
positive) indicators from America command over the next several weeks? Markets
may be more volatile this month than we’ve been accustomed to during a mostly
placid 2014.21
UPCOMING ECONOMIC
RELEASES: The roll call of releases
for the rest of August: June wholesale inventories (8/8), June business
inventories and July retail sales (8/13), July’s PPI and July industrial output
and the University of Michigan’s initial August consumer sentiment index
(8/15), the July CPI plus July housing starts and building permits (8/19), the minutes
of the July Fed policy meeting (8/20), July existing home sales and the Conference
Board’s July index of leading indicators (8/21), July new home sales (8/25), the
Conference Board’s August consumer confidence index, July durable goods orders and
June’s Case-Shiller home price index (8/26), the federal government’s second
reading of Q2 GDP and NAR’s July pending home sales report (8/28), and then
July personal spending and the final University of Michigan August consumer
sentiment index (8/29).
To Your Prosperity,
Kevin Kroskey, CFP®, MBA
This article adapted with permission from MarketingLibrary.net.
Citations.
1 - blogs.marketwatch.com/thetell/2014/07/31/stock-market-live-blog-selling-as-european-argentine-worries-weigh-whole-foods-falls/ [7/31/14]
2 - online.wsj.com/mdc/public/page/2_3023-monthly_gblstkidx.html [7/31/14]
3 - biz.yahoo.com/c/ec/201431.html [8/4/14]
4 - briefing.com/investor/calendars/economic/2014/07/14-18 [7/18/14]
5 - marketwatch.com/story/us-adds-209000-jobs-in-july-to-keep-hot-streak-intact-2014-08-01 [8/1/14]
6 - latimes.com/business/la-fi-durable-goods-manufacturing-economy-20140725-story.html [7/25/14]
7 - investing.com/economic-calendar/ [7/25/14]
8 - marketwatch.com/story/wages-finally-rising-which-could-force-fed-to-hike-2014-07-31 [7/31/14]
9 - marketwatch.com/story/fed-plans-to-end-bond-purchases-in-october-2014-07-09 [7/9/14]
10 - americasmarkets.usatoday.com/2014/07/31/5-things-to-know-about-argentine-debt-crisis/ [7/31/14]
11 - money.msn.com/business-news/article.aspx?feed=BLOOM&date=20140711&id=17768873 [7/11/14]
12 - usa.chinadaily.com.cn/epaper/2014-08/04/content_18244118.htm13 [8/4/14]
13 - tinyurl.com/kj9dxa3 [7/24/14]
14 - mscibarra.com/products/indices/international_equity_indices/gimi/stdindex/performance.html [7/31/14]
15 - money.cnn.com/data/commodities/ [7/31/14]
16 - online.wsj.com/mdc/public/npage/2_3050.html?mod=mdc_curr_dtabnk&symb=DXY [8/4/14]
17 - cbsnews.com/news/new-home-sales-plunge-8-1-percent/ [7/24/14]
18 - freddiemac.com/pmms/archive.html [8/1/14]
19 - bigcharts.marketwatch.com/historical/default.asp?symb=DJIA&closeDate=7%2F31%2F13&x=0&y=0 [7/31/14]
19 - bigcharts.marketwatch.com/historical/default.asp?symb=COMP&closeDate=7%2F31%2F13&x=0&y=0 [7/31/14]
19 - bigcharts.marketwatch.com/historical/default.asp?symb=SPX&closeDate=7%2F31%2F13&x=0&y=0 [7/31/14]
19 - bigcharts.marketwatch.com/historical/default.asp?symb=DJIA&closeDate=7%2F30%2F04&x=0&y=0 [7/31/14]
19 - bigcharts.marketwatch.com/historical/default.asp?symb=COMP&closeDate=7%2F30%2F04&x=0&y=0 [7/31/14]
19 - bigcharts.marketwatch.com/historical/default.asp?symb=SPX&closeDate=7%2F30%2F04&x=0&y=0 [7/31/14]
20 - treasury.gov/resource-center/data-chart-center/interest-rates/Pages/TextView.aspx?data=realyieldAll [8/4/14]
21 - money.cnn.com/2014/08/02/investing/stock-market-lookahead/ [8/2/14]


