You could say that the markets took a
breather in the third quarter of 2014, but you would come to that conclusion
only if you looked at the overall returns and ignored the drama of the past 30
days. The markets experienced a
difficult month of September, giving up some of the gains from the prior eight
months and causing investors to worry that we’re about to experience more of
the same. The end of the month was
especially difficult, with a general market slide starting September 22, and
some indices dropping more than 1% on the final day.
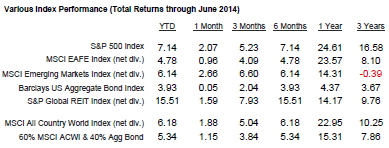
Key index performance is shown in the table below.
Key index performance is shown in the table below.
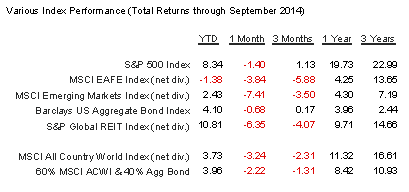
The Wilshire 5000--the broadest measure of U.S. stocks and bonds--rose a meager 0.37% for the third quarter even as it lost 1.71% in September. But the index is hanging on to a 7.26% gain for the year.
Large cap stocks were the market leaders over
the past three months, but the gains were modest. The news was less happy for smaller
stocks. Small company stocks, as measured by the
Russell 2000 Index fell 7.60% in the third quarter, representing its
worst quarter in three years.
The rest of the world put a drag on
diversified investment portfolios. The
broad-based EAFE index of companies in developed economies fell 3.84% in dollar
terms during the third quarter of the year, and is now down 1.38% so far in
2014. The stocks across the Eurozone
economies contributed to the foreign stock slide, but the red ink spilled over to most of the foreign indices in Asia as
well.
Looking over the other investment
categories, real estate investments, as measured by the Wilshire REIT index,
fell 2.54% for the quarter, but the index is standing at a robust 15.08% gain
for the first three quarters of the year.
Commodities, as measured by the S&P GSCI index, fell 12.46% this
past quarter, and now sit at a loss of 7.46% for the year.
The expected rise in bond rates never
materialized, confounding the experts yet again. The Barclays aggregate bond index has return 4.10% year-to-date. The Bloomberg U.S. Corporate Bond Index now
has an effective yield of 3.07%, while Treasury rates held steady. 30-year Treasuries are yielding 3.20%, and
10-year Treasuries currently yield 2.50%.
At the low end, 3-month T-bills are still yielding a miniscule 0.02%;
6-month bills are only slightly more generous, at 0.04%.
Nobody seems to have a convincing
explanation for the recent stock market slump.
The economy still seems to be pushing along in a long slow, steady
growth process, and corporate earnings are well-above historical averages. Oil prices are at their lowest level since
November 2012, consumer spending has rebounded, and although the Fed will cease
its bond purchases this month, there is no indication that it is going to sell
its inventory back on the market, and its policymakers are projecting low
interest rates well into 2015. Corporate
cash at larger corporations is near an all-time high.
But pullbacks don’t always reflect
reality. They are also affected by the
sentiment of investors--in other words, human emotions and a crowd (or herd)
mentality. Investors seem to be worried
that stocks are overdue for a correction, and if these things operated on a
schedule, they would be right. We are in
the fourth-longest bull market since 1928, without having experienced even a
small 10% correction since 2011. The
Conference Board reported that U.S. Consumer Confidence slipped dramatically,
and unexpectedly, in September, lending some credibility to the surmise that
the investing herd has been startled--and their expectations appear to be
creating market reality.
Does that mean we should take action? Unfortunately, nobody knows whether the
markets are poised to act on the good economic news and move up, or are ready
for another fearful selloff that would finally deliver that long-delayed
correction. History tells us that it’s a
fool’s game to try to anticipate market corrections, and that investors usually
get rewarded for sailing through choppy waters, rather than jumping off the
ship when the waves get higher.
You can’t know in which direction the
markets will experience their next 10%, 20% or 30% move. But unless you believe the world is about to
end, you do know, with some degree of certainty, in which direction it will
make its next 100% move.
Now is a good time to re-examine your expectations for investment returns and always be mindful of your planning and when you'll need money. The purpose of your investment portfolio is to make your financial life plan work and meet the cash flows you and your advisor define.
If you have a plan in place, you're much more likely to behave rationally and proactively than react in an unprudent manner to bad news.
To Your Prosperity,
Kevin Kroskey, CFP®, MBA
Adapted
with permission from Bob Veres.
Sources:
Wilshire index data: http://www.wilshire.com/Indexes/calculator/
Russell index data: http://www.russell.com/indexes/data/daily_total_returns_us.asp
S&P index data: http://www.standardandpoors.com/indices/sp-500/en/us/?indexId=spusa-500-usduf--p-us-l--
http://money.cnn.com/2014/09/30/investing/stocks-market-september-slump/index.html
Nasdaq index data: http://quicktake.morningstar.com/Index/IndexCharts.aspx?Symbol=COMP
International indices: http://www.mscibarra.com/products/indices/international_equity_indices/performance.html
Commodities index data: http://us.spindices.com/index-family/commodities/sp-gsci
Treasury market rates: http://www.bloomberg.com/markets/rates-bonds/government-bonds/us/
http://blogs.marketwatch.com/thetell/2014/06/30/one-chart-explains-the-unexpected-first-half-treasury-rally/
Aggregate corporate bond rates: https://indices.barcap.com/show?url=Benchmark_Indices/Aggregate/Bond_Indices
Aggregate corporate bond rates: http://www.bloomberg.com/markets/rates-bonds/corporate-bonds/