December 20, 2010 Weekly Market Commentary

OBAMA SIGNS TAX DEAL INTO LAW
President Obama signed the 2010 Tax Relief Act into law on December 17 after overwhelming passage in the House and Senate. The Bush-era tax cuts are thereby extended. Through 2012, the federal income tax tops out at 35% and taxes on dividends and capital gains top out at 15%. The 0% rate for long term gains realized in the 15% tax bracket is still in place and presents a tremendous tax planning opportunity, particularly for retirees that haven't yet started receiving Social Security and/or pension income.

Next year, the estate tax returns at 35% with a $5 million dollar exemption, effectively permitting couples to pass estates as large as $10 million to heirs; tax-free charitable IRA donations also come back in 2011. Employee payroll taxes will drop from 6.2% to 4.2% next year.1,2,3,4,5

A POSITIVE SIGNAL FOR THE FUTURE
The Conference Board’s leading economic indicators index (designed to be a gauge of economic momentum or lack thereof) jumped by 1.1% in November – the biggest gain in eight months. This follows a revised 0.4% advance in the index for October.6

PRODUCER PRICES OUTPACE CONSUMER PRICES
Consumer prices inched up 0.1% in November according to the Labor Department’s Consumer Price Index. The core CPI rose 0.1%. The Producer Price Index, on the other hand, rose by 0.8% last month. Consensus polls of economists at Briefing.com had projected a 0.2% rise in the CPI and a 0.5% gain in wholesale prices.7

HOUSING STARTS TURN NORTH
They improved for the first time in three months. The Commerce Department said November’s housing starts were up 3.9% from October levels. The 555,000 annual pace topped the 559,000 consensus projected in a Bloomberg News survey.8

STOCKS ADVANCE
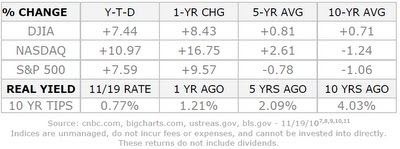
It was a pretty quiet week on Wall Street, and major index performance across the five trading days was as follows: Dow, +0.72% to 11,491.91; S&P 500, +0.28% to 1,243.91; NASDAQ, +0.21% to 2,642.97. As of Friday, the DJIA had traded within a range of 100 points for six straight market days – that hadn’t occurred since January 2006. All three indices ended the week at +10% or better for 2010.9

COMING NEXT WEEK: No notable releases on Monday or Tuesday. Wednesday, we have the latest existing home sales figures and the final estimate of 3Q GDP. Thursday, we get data on consumer spending and durable goods orders for November, new home sales figures for November, the final University of Michigan consumer sentiment survey for December, and the latest initial and continuing claims numbers. That’s it for the week.


WEEKLY QUOTE
“It is not the years in your life but the life in your years that counts.”
– Adlai Stevenson

WEEKLY TIP
With the new year coming, one of your resolutions can be reviewing and/or rebalancing your portfolio, to see that your investments are in sync with your objectives.

Happy Holidays,

Kevin Kroskey

Bookmark and Share


Citations.

1 edition.cnn.com/2010/POLITICS/12/17/tax.deal/ [12/17/10]
2 – online.wsj.com/article/SB10001424052748703296604576005430598327972.html [12/7/10]
3 –tax.cchgroup.com/downloads/files/pdfs/legislation/bush-taxcuts.pdf [12/16/10]
4 – businessweek.com/ap/financialnews/D9K5IEN81.htm [12/17/10]
5 – npr.org/2010/12/10/131969824/some-worry-payroll-tax-cut-threatens-social-security [12/17/10]
6 - bloomberg.com/news/2010-12-17/u-s-leading-indicators-index-gains-most-in-eight-months-in-recovery-sign.html [12/17/10]
7 - thestreet.com/story/10947594/1/inflation-remains-subdued-in-november.html [12/15/10]
8 - bloomberg.com/news/2010-12-16/u-s-futures-fluctuate-starbucks-bank-of-america-climb-freeport-slides.html [12/16/10]
9 - cnbc.com/id/40722779 [12/17/10]
10 - bigcharts.marketwatch.com/historical/default.asp?detect=1&symbol=DJIA&close_date=12%2F17%2F09&x=0&y=0 [12/17/10]
10 - bigcharts.marketwatch.com/historical/default.asp?detect=1&symbol=COMP&close_date=12%2F17%2F09&x=0&y=0 [12/17/10]
10 - bigcharts.marketwatch.com/historical/default.asp?detect=1&symbol=SPX&close_date=12%2F17%2F09&x=0&y=0 [12/17/10]
10 - bigcharts.marketwatch.com/historical/default.asp?detect=1&symbol=DJIA&close_date=12%2F16%2F05&x=0&y=0 [12/17/10]
10 - bigcharts.marketwatch.com/historical/default.asp?detect=1&symbol=COMP&close_date=12%2F16%2F05&x=0&y=0 [12/17/10]
10 - bigcharts.marketwatch.com/historical/default.asp?detect=1&symbol=SPX&close_date=12%2F16%2F05&x=0&y=0 [12/17/10]
10 - bigcharts.marketwatch.com/historical/default.asp?detect=1&symbol=DJIA&close_date=12%2F18%2F00&x=0&y=0 [12/17/10]
10 - bigcharts.marketwatch.com/historical/default.asp?detect=1&symbol=COMP&close_date=12%2F18%2F00&x=0&y=0 [12/17/10]
10 - bigcharts.marketwatch.com/historical/default.asp?detect=1&symbol=SPX&close_date=12%2F18%2F00&x=0&y=0 [12/17/10]
11 - treasury.gov/resource-center/data-chart-center/interest-rates/Pages/TextView.aspx?data=realyield [12/17/10]
11 - ustreas.gov/offices/domestic-finance/debt-management/interest-rate/real_yield_historical.shtml [12/17/10]
12 - treasurydirect.gov/instit/annceresult/press/preanre/2000/ofm11200.pdf [7/12/00]
13 - montoyaregistry.com/Financial-Market.aspx?financial-market=8-retirement-tips&category=3 [12/18/10]

This material was prepared by Peter Montoya Inc., and does not necessarily represent the views of the presenting party, nor their affiliates. This information should not be construed as investment, tax or legal advice. The Dow Jones Industrial Average is a price-weighted index of 30 actively traded blue-chip stocks. The NASDAQ Composite Index is an unmanaged, market-weighted index of all over-the-counter common stocks traded on the National Association of Securities Dealers Automated Quotation System. The Standard & Poor's 500 (S&P 500) is an unmanaged group of securities considered to be representative of the stock market in general. It is not possible to invest directly in an index. NYSE Group, Inc. (NYSE:NYX) operates two securities exchanges: the New York Stock Exchange (the “NYSE”) and NYSE Arca (formerly known as the Archipelago Exchange, or ArcaEx®, and the Pacific Exchange). NYSE Group is a leading provider of securities listing, trading and market data products and services. The New York Mercantile Exchange, Inc. (NYMEX) is the world's largest physical commodity futures exchange and the preeminent trading forum for energy and precious metals, with trading conducted through two divisions – the NYMEX Division, home to the energy, platinum, and palladium markets, and the COMEX Division, on which all other metals trade. Additional risks are associated with international investing, such as currency fluctuations, political and economic instability and differences in accounting standards. All information is believed to be from reliable sources; however we make no representation as to its completeness or accuracy. All economic and performance data is historical and not indicative of future results. Market indices discussed are unmanaged. Investors cannot invest in unmanaged indices. The publisher is not engaged in rendering legal, accounting or other professional services. If assistance is needed, the reader is advised to engage the services of a competent professional.

December 6, 2010 Weekly Market Commentary

DECEMBER GETS OFF TO A BULLISH START

Recently, it's almost comical watching the market see-saw back and forth as emotionally-based investors swing with tides of varying economonic news. In the first three days of December, the S&P 500 gained 3.74% as Black Friday sales numbers and reassurance from the European Central Bank aided Wall Street. Gold closed at a record $1406.20 an ounce Friday. Then things swung the other way. Yet for the week, the big three U.S. indices performed as follows: DJIA, +2.62% to 11,382.09; S&P 500, +2.97% to 1,224.71; NASDAQ, +2.24% to 2,591.46 (its highest close in 35 months). (6,7)


JOBLESS RATE INCREASES BY 0.2%
Unemployment hit 9.8% last month. The latest Bureau of Labor Statistics report said the economy only created 39,000 new jobs in November; economists expected three times that. After all, ADP reported 93,000 new positions in the private sector last Wednesday, and the revised government estimate for October showed the economy adding 172,000 jobs in that month. Labor Department figures indicate that the unemployed and underemployed now make up around 17% of the population. (1,2)

SECOND POLL GAUGES CONFIDENCE AT 5-MONTH HIGH
The Conference Board’s consumer confidence index rose to 54.1 for November, reaching a peak unseen since June (which is exactly what happened last week with the University of Michigan’s consumer poll). Sub-indices measuring employment expectations and income expectations also improved. (3)

SOME GOOD NEWS FROM THE REAL ESTATE SECTOR
Pending home sales increased by 10.4% in October, according to the National Association of Realtors. This would seem to suggest better numbers for existing home sales in November. NAR’s pending home sales index is now back at the level it was before the appearance of the federal home buyer tax credit. (4)

ISM INDEXES BOTH AT 55 OR BETTER
The closely-watched manufacturing and non-manufacturing sector surveys from the Institute for Supply Management show moderate growth. The manufacturing index declined to 56.6 from October’s 56.9 mark; the service sector index improved from 54.3 in October to 55.0 in November. The manufacturing index showed a 7.7% slump in production for November; the service sector index showed 4.0% gains in export orders and inventories. (5)

COMING NEXT WEEK: It is a light week in terms of major economic releases. Wednesday, we get initial and continuing jobless claims data and learn about October wholesale inventories. Thursday, we have the University of Michigan’s first consumer sentiment survey for December.


WEEKLY QUOTE
“Nothing will ever be attempted, if all possible objections must be first overcome.”
– Samuel Johnson

WEEKLY TIP
Have you taken a Required Minimum Distribution from your IRA yet? If you are age 70½ or older, it’s time. If you are taking your very first RMD, you can put it off until April 1 of next year - but if you do that, you’ll have to take two RMDs in 2011. The RMD deadline for most IRA owners aged 70½ or older is December 31.

Best Regards,

Kevin Kroskey


Bookmark and Share


Citations.
1 - forbes.com/2010/12/03/markets-briefing-open-jobs-equities-unemployment.html [12/3/10]

2 - ocregister.com/articles/rate-278642-november-time.html [12/3/10]
3 - bloomberg.com/news/2010-11-30/stocks-in-u-s-pare-retreat-after-consumer-confidence-report-tops-estimate.html [11/30/10]
4 - online.wsj.com/article/SB10001424052748703377504575650470810345484.html [12/3/10]
5 - ism.ws/ISMReport/nonmfgROB.cfm [12/3/10]
6 - cnbc.com/id/40496761 [12/3/10]
7 - money.cnn.com/2010/12/03/markets/markets_newyork/index.htm [12/3/10]
8 - bigcharts.marketwatch.com/historical/default.asp?detect=1&symbol=DJIA&close_date=12%2F3%2F09&x=0&y=0 [12/3/10]
8 - bigcharts.marketwatch.com/historical/default.asp?detect=1&symbol=COMP&close_date=12%2F3%2F09&x=0&y=0 [12/3/10]
8 - bigcharts.marketwatch.com/historical/default.asp?detect=1&symbol=SPX&close_date=12%2F3%2F09&x=0&y=0 [12/3/10]
8 - bigcharts.marketwatch.com/historical/default.asp?detect=1&symbol=DJIA&close_date=12%2F2%2F05&x=0&y=0 [12/3/10]
8 - bigcharts.marketwatch.com/historical/default.asp?detect=1&symbol=COMP&close_date=12%2F2%2F05&x=0&y=0 [12/3/10]
8 - bigcharts.marketwatch.com/historical/default.asp?detect=1&symbol=SPX&close_date=12%2F2%2F05&x=0&y=0 [12/3/10]
8 - bigcharts.marketwatch.com/historical/default.asp?detect=1&symbol=DJIA&close_date=12%2F4%2F00&x=0&y=0 [12/3/10]
8 - bigcharts.marketwatch.com/historical/default.asp?detect=1&symbol=COMP&close_date=12%2F4%2F00&x=0&y=0 [12/3/10]
8 - bigcharts.marketwatch.com/historical/default.asp?detect=1&symbol=SPX&close_date=12%2F4%2F00&x=0&y=0 [12/3/10]
9 - ustreas.gov/offices/domestic-finance/debt-management/interest-rate/real_yield.shtml [12/3/10]
9 - ustreas.gov/offices/domestic-finance/debt-management/interest-rate/real_yield_historical.shtml [12/3/10]
10 - treasurydirect.gov/instit/annceresult/press/preanre/2000/ofm11200.pdf [7/12/00]


This material was prepared by Peter Montoya Inc., and does not necessarily represent the views of the presenting party, nor their affiliates. This information should not be construed as investment, tax or legal advice. The Dow Jones Industrial Average is a price-weighted index of 30 actively traded blue-chip stocks. The NASDAQ Composite Index is an unmanaged, market-weighted index of all over-the-counter common stocks traded on the National Association of Securities Dealers Automated Quotation System. The Standard & Poor's 500 (S&P 500) is an unmanaged group of securities considered to be representative of the stock market in general. It is not possible to invest directly in an index. NYSE Group, Inc. (NYSE:NYX) operates two securities exchanges: the New York Stock Exchange (the “NYSE”) and NYSE Arca (formerly known as the Archipelago Exchange, or ArcaEx®, and the Pacific Exchange). NYSE Group is a leading provider of securities listing, trading and market data products and services. The New York Mercantile Exchange, Inc. (NYMEX) is the world's largest physical commodity futures exchange and the preeminent trading forum for energy and precious metals, with trading conducted through two divisions – the NYMEX Division, home to the energy, platinum, and palladium markets, and the COMEX Division, on which all other metals trade. Additional risks are associated with international investing, such as currency fluctuations, political and economic instability and differences in accounting standards. All information is believed to be from reliable sources; however we make no representation as to its completeness or accuracy. All economic and performance data is historical and not indicative of future results. Market indices discussed are unmanaged. Investors cannot invest in unmanaged indices. The publisher is not engaged in rendering legal, accounting or other professional services. If assistance is needed, the reader is advised to engage the services of a competent professional.


November 22, 2010 Weekly Market Commentary

NO RISE IN CORE CPI OR CORE PPI IN OCTOBER
Last month, the Consumer Price Index rose 0.2% with core CPI flat for the third month in a row. Core CPI has advanced at a crawl in the past 12 months: just 0.6% compared to a Federal Reserve annualized target of 2.0%. Producer prices rose 0.4% last month, duplicating their August and September increase. Yet core producer prices fell 0.6%.1,2

HOUSING STARTS SLIP, MORTGAGE RATES JUMP
The Commerce Department announced an 11.7% slump in new residential construction starts for the month of October, and a 1.9% slip from year-ago levels. A drop in apartment and condo construction accounted for most of the October decline. Last week, Freddie Mac said that the average rate on a 30-year conventional home loan had jumped to 4.39% from 4.17% a week prior. The average rate for a 15-year FRM had increased to 3.76%, up from 3.57% in Freddie’s previous survey.3,4

RETAIL SALES 7.3% BETTER THAN A YEAR AGO
Car buying drove a 1.2% gain in U.S. retail sales in October. In fact, the Census Bureau reported a 14.7% year-over-year increase in sales volume at car dealerships. The year-over-year gain in overall retail sales was 7.3%, and 13.5% for non-store retailers.5

CONFERENCE BOARD INDEX UP 0.5%
The Conference Board’s index of leading economic indicators notched its second straight half-percent increase in October. This was also its fourth straight advance.6

GM IPO TURNS THE WEEK AROUND
Thursday’s eagerly awaited initial public offering from General Motors sent the Dow on a triple-digit rally and turned a down week into a flat one. Here is how the three marquee indices performed last week: DJIA, +0.10% to 11,203.55; S&P 500, +0.04% to 1,199.73; NASDAQ, 0.00% to 2,518.12 (it actually fell .09 on the week).7,8

COMING NEXT WEEK: No economic releases are scheduled for Monday. Tuesday, we have October existing home sales and the release of the minutes from the Fed’s November 3 policy meeting, plus the second estimate of 3Q GDP. Wednesday, we have even more data: the October consumer spending report, October new home sales, October durable goods orders and the final November consumer sentiment survey from the University of Michigan.

 
WEEKLY QUOTE
“You are the only real obstacle in your path to a fulfilling life.”
– Les Brown

WEEKLY TIP
Ramp up your college savings with rewards programs. There are credit cards and online shopping programs that can allow you to direct a steady stream of rebates toward your education fund.


Best Regards,

Kevin Kroskey


Bookmark and Share


Citations.
1 - marketwatch.com/story/us-consumer-prices-up-02-in-october-2010-11-17 [11/17/10]
2 - blogs.barrons.com/stockstowatchtoday/2010/11/16/producer-prices-lower-than-expected-but-crude-prices-jump/ [11/16/10]
3 - articles.latimes.com/print/2010/nov/18/business/la-fi-housing-mortgage-20101118 [11/18/10]
4 - freddiemac.com/pmms/release.html [11/18/10]
5 - census.gov/retail/marts/www/marts_current.pdf [11/15/10]
6 -boston.com/news/nation/washington/articles/2010/11/19/new_figures_indicate_economy_is _picking_up [11/19/10]
7 - cnbc.com/id/40279101 [11/19/10]
8 - cnbc.com/id/40155548 [11/12/10]
9 - bigcharts.marketwatch.com/historical/default.asp?detect=1&symbol=DJIA&close_date=11%2F19%2F09&x=0&y=0 [11/19/10]
9 - bigcharts.marketwatch.com/historical/default.asp?detect=1&symbol=COMP&close_date=11%2F19%2F09&x=0&y=0 [11/19/10]
9 - bigcharts.marketwatch.com/historical/default.asp?detect=1&symbol=SPX&close_date=11%2F19%2F09&x=0&y=0 [11/19/10]
9 - bigcharts.marketwatch.com/historical/default.asp?detect=1&symbol=DJIA&close_date=11%2F18%2F05&x=0&y=0 [11/19/10]
9 - bigcharts.marketwatch.com/historical/default.asp?detect=1&symbol=COMP&close_date=11%2F18%2F05&x=0&y=0 [11/19/10]
9 - bigcharts.marketwatch.com/historical/default.asp?detect=1&symbol=SPX&close_date=11%2F18%2F05&x=0&y=0 [11/19/10]
9 - bigcharts.marketwatch.com/historical/default.asp?detect=1&symbol=DJIA&close_date=11%2F20%2F00&x=0&y=0 [11/19/10]
9 - bigcharts.marketwatch.com/historical/default.asp?detect=1&symbol=COMP&close_date=11%2F20%2F00&x=0&y=0 [11/19/10]
9 - bigcharts.marketwatch.com/historical/default.asp?detect=1&symbol=SPX&close_date=11%2F20%2F00&x=0&y=0 [11/19/10]
10 - ustreas.gov/offices/domestic-finance/debt-management/interest-rate/real_yield.shtml [11/19/10]
10 - ustreas.gov/offices/domestic-finance/debt-management/interest-rate/real_yield_historical.shtml [11/19/10]
11 - treasurydirect.gov/instit/annceresult/press/preanre/2000/ofm11200.pdf [7/12/00]

This material was prepared by Peter Montoya Inc., and does not necessarily represent the views of the presenting party, nor their affiliates. This information should not be construed as investment, tax or legal advice. The Dow Jones Industrial Average is a price-weighted index of 30 actively traded blue-chip stocks. The NASDAQ Composite Index is an unmanaged, market-weighted index of all over-the-counter common stocks traded on the National Association of Securities Dealers Automated Quotation System. The Standard & Poor's 500 (S&P 500) is an unmanaged group of securities considered to be representative of the stock market in general. It is not possible to invest directly in an index. NYSE Group, Inc. (NYSE:NYX) operates two securities exchanges: the New York Stock Exchange (the “NYSE”) and NYSE Arca (formerly known as the Archipelago Exchange, or ArcaEx®, and the Pacific Exchange). NYSE Group is a leading provider of securities listing, trading and market data products and services. The New York Mercantile Exchange, Inc. (NYMEX) is the world's largest physical commodity futures exchange and the preeminent trading forum for energy and precious metals, with trading conducted through two divisions – the NYMEX Division, home to the energy, platinum, and palladium markets, and the COMEX Division, on which all other metals trade. Additional risks are associated with international investing, such as currency fluctuations, political and economic instability and differences in accounting standards. All information is believed to be from reliable sources; however we make no representation as to its completeness or accuracy. All economic and performance data is historical and not indicative of future results. Market indices discussed are unmanaged. Investors cannot invest in unmanaged indices. The publisher is not engaged in rendering legal, accounting or other professional services. If assistance is needed, the reader is advised to engage the services of a competent professional.

November 8, 2010 Weekly Market Commentary

FIRST NET JOB GAIN SINCE MAY
Economists polled by Dow Jones Newswires thought non-farm payrolls would increase by about 60,000 for October. In a pleasant surprise, the economy added 151,000 jobs instead. While the jobless rate remained at 9.6% for October, Labor Department data showed the economy adding jobs for the first time in five months – a development implying moderate growth instead of a “double dip” recession.1

TWO MORE SIGNALS OF EXPANSION
The Institute for Supply Management released its October assessments of the manufacturing and service sectors last week, and both ISM indices showed improvement. The manufacturing index climbed to 56.9 from 54.4 and the service sector index improved to 54.3 from September’s 53.2 reading.2

CONSUMERS SPEND A BIT MORE
September’s personal spending gain wasn’t that impressive – just 0.2%. Economists surveyed by Bloomberg had forecast a 0.4% increase in for the month. The Commerce Department data also showed a 0.1% decrease in personal income, the first such reduction since July 2009.3

PENDING HOME SALES SUDDENLY SLIP
They fell by 1.8% in September, according to the National Association of Realtors. They haven’t declined in three months. September 2010 pending sales were 24.9% underneath year-ago levels.4

STOCKS HIT 2010 HIGHS
The Dow, S&P 500 and NASDAQ quickly reached YTD peaks after the Federal Reserve announced its plans to buy $600 billion worth of Treasuries over the next eight months. Here is how the big three performed last week: Dow, +2.93% to 11,444.08; S&P 500, +3.60% to 1,225.85; NASDAQ, +2.85% to 2,578.98. Some key commodities took off as well – oil prices gained $5.42 on the week, gold gained $40.20 across five days to close at $1,397.30 on the COMEX Friday, and copper advanced 5.68% for the week.5,6,7

COMING NEXT WEEK: The schedule of economic releases is very light. Tuesday, we have data on September wholesale inventories. Wednesday, we have initial jobless claims for 11/6 and continuing claims as of 10/30. Friday, we get the initial October survey of consumer sentiment from the University of Michigan.

(Click on the picture below to enlarge the table in a new window.)


WEEKLY QUOTE
“The book you don’t read won’t help.”
– Jim Rohn

Best Regards,

Kevin Kroskey

Bookmark and Share


Citations.
1 – online.wsj.com/article/SB10001424052748704353504575596060581399440.html [11/5/10]
2 - ism.ws/ISMReport/NonMfgROB.cfm [11/3/10]
3 - blogs.barrons.com/stockstowatchtoday/2010/11/01/markets-open-higher-despite-spending-woes [11/1/10]
4 - dailyfinance.com/story/real-estate/september-pending-home-sales-drop-uneven-economic-recovery/19704428/ [11/5/10]
5 - csmonitor.com/Business/2010/1103/Federal-Reserve-to-buy-600-billion-in-bonds-as-hedge-against-deflation [11/3/10]
6 - cnbc.com/id/40032470 [11/5/10]
7 - blogs.wsj.com/marketbeat/2010/11/05/data-points-energy-metals-396/ [11/5/10]
8 - bigcharts.marketwatch.com/historical/default.asp?detect=1&symbol=DJIA&close_date=11%2F5%2F09&x=0&y=0 [11/5/10]
8 - bigcharts.marketwatch.com/historical/default.asp?detect=1&symbol=COMP&close_date=11%2F5%2F09&x=0&y=0 [11/5/10]
8 - bigcharts.marketwatch.com/historical/default.asp?detect=1&symbol=SPX&close_date=11%2F5%2F09&x=0&y=0 [11/5/10]
8 - bigcharts.marketwatch.com/historical/default.asp?detect=1&symbol=DJIA&close_date=11%2F4%2F05&x=0&y=0 [11/5/10]
8 - bigcharts.marketwatch.com/historical/default.asp?detect=1&symbol=COMP&close_date=11%2F4%2F05&x=0&y=0 [11/5/10]
8 - bigcharts.marketwatch.com/historical/default.asp?detect=1&symbol=SPX&close_date=11%2F4%2F05&x=0&y=0 [11/5/10]
8 - bigcharts.marketwatch.com/historical/default.asp?detect=1&symbol=DJIA&close_date=11%2F6%2F00&x=0&y=0 [11/5/10]
8 - bigcharts.marketwatch.com/historical/default.asp?detect=1&symbol=COMP&close_date=11%2F6%2F00&x=0&y=0 [11/5/10]
8 - bigcharts.marketwatch.com/historical/default.asp?detect=1&symbol=SPX&close_date=11%2F6%2F00&x=0&y=0 [11/5/10]
9 - ustreas.gov/offices/domestic-finance/debt-management/interest-rate/real_yield.shtml [11/5/10]
9 - ustreas.gov/offices/domestic-finance/debt-management/interest-rate/real_yield_historical.shtml [11/5/10]
10 - treasurydirect.gov/instit/annceresult/press/preanre/2000/ofm11200.pdf [7/12/00]


This material was prepared by Peter Montoya Inc., and does not necessarily represent the views of the presenting party, nor their affiliates. This information should not be construed as investment, tax or legal advice. The Dow Jones Industrial Average is a price-weighted index of 30 actively traded blue-chip stocks. The NASDAQ Composite Index is an unmanaged, market-weighted index of all over-the-counter common stocks traded on the National Association of Securities Dealers Automated Quotation System. The Standard & Poor's 500 (S&P 500) is an unmanaged group of securities considered to be representative of the stock market in general. It is not possible to invest directly in an index. NYSE Group, Inc. (NYSE:NYX) operates two securities exchanges: the New York Stock Exchange (the “NYSE”) and NYSE Arca (formerly known as the Archipelago Exchange, or ArcaEx®, and the Pacific Exchange). NYSE Group is a leading provider of securities listing, trading and market data products and services. The New York Mercantile Exchange, Inc. (NYMEX) is the world's largest physical commodity futures exchange and the preeminent trading forum for energy and precious metals, with trading conducted through two divisions – the NYMEX Division, home to the energy, platinum, and palladium markets, and the COMEX Division, on which all other metals trade. Additional risks are associated with international investing, such as currency fluctuations, political and economic instability and differences in accounting standards. All information is believed to be from reliable sources; however we make no representation as to its completeness or accuracy. All economic and performance data is historical and not indicative of future results. Market indices discussed are unmanaged. Investors cannot invest in unmanaged indices. The publisher is not engaged in rendering legal, accounting or other professional services. If assistance is needed, the reader is advised to engage the services of a competent professional.

November 1, 2010 Weekly Market Commentary

WALL STREET AWAITS QE2, CONSIDERS 3Q GDP
Yes, QE2 – that is the media nickname for the expected second round of quantitative easing from the Federal Reserve, a move which could boost long-term bond prices and lower long-term interest rates. Will the Fed buy more than $500 billion in Treasuries? Or less? The Wall Street Journal says the purchases will amount to “a few hundred billion dollars over several months.” The Fed will reveal its plans on Wednesday at the end of its November policy meeting. Meanwhile, the initial third quarter GDP reading is in: +2.0%. The good news: consumer spending in 3Q 2010 was the strongest in four years. The bad news: a 2.0% gain in GDP isn’t strong enough to reduce unemployment.1,2

HOME SALES PICK UP
Existing home sales improved 10.0% in September – the biggest one-month leap since the National Association of Realtors began keeping track of monthly sales volume. The median price was still 2.4% below year-ago levels. New home sales rose 6.6% in September, with the median price up 3.3% from 12 months ago. In related news, the August S&P/Case-Shiller home price index showed a year-over-year gain of 1.7% across 20 metro markets.3,4,5

CONSUMER SENTIMENT WAVERS
The Conference Board’s survey of consumer confidence reached 50.2 this month, a 1.6% improvement. However, the final October Reuters/University of Michigan survey hit an 11-month low of 67.7, perhaps on election season pessimism.6,7

DURABLE GOODS ORDERS RISE 3.3%
September’s overall gain was mostly attributable to a 105% jump in aircraft orders. Core durable goods orders declined by 0.6% on the month.8

MARKETS MOVE CAUTIOUSLY
Wall Street largely held its breath last week, waiting for November’s data and policy moves. The performance across the last five trading days of October: Dow, -0.13% to 11,118.49; S&P 500, +0.02% to 1,183.26; NASDAQ, +1.13% to 2,507.41.9

COMING NEXT WEEK: Monday, we have September consumer spending and construction spending data and the October ISM manufacturing report. Wednesday is also big – the Fed announcement comes at 2:15pm EST, and before that we get the ISM service sector report for October, plus data on October auto sales and September factory orders. Thursday, we receive the latest initial claims figures. Friday, we have the October unemployment report and September pending home sales.

(Click on the picture below to enlarge the table in a new window.)


WEEKLY QUOTE
“One loyal friend is worth ten thousand relatives.”
– Euripides

WEEKLY TIP
If you like to itemize, consider organizing your receipts by expense type. It will save your accountant time and help them on their quest to save you money.


Best Regards,

Kevin Kroskey

Bookmark and Share

Citations.
1 –online.wsj.com/article/SB10001424052702303891804575576533845166848.html [10/25/10]
2 – abcnews.go.com/Business/wireStory?id=12000624 [10/29/10]
3 – businessweek.com/news/2010-10-25/u-s-existing-home-sales-rise-more-than-forecast.html [10/25/10]
4 - blogs.wsj.com/developments/2010/10/27/new-home-sales-stuck-at-rock-bottom/?mod=google_news_blog [10/27/10]
5 - bloomberg.com/news/2010-10-26/home-prices-in-20-u-s-cities-rose-less-than-forecast-case-shiller-says.html [10/26/10]
6 - theatlantic.com/business/archive/2010/10/consumer-confidence-remains-weak-going-into-midterms/65173/ [10/26/10]
7 - dailyfinance.com/story/consumer-sentiment-dips-on-economic-concerns-ahead-of-elections/19694879/ [10/29/10]
8 - marketwatch.com/story/durable-goods-orders-jump-33-in-september-2010-10-27 [10/27/10]
9 – cnbc.com/id/39916022 [10/29/10]
10 - bigcharts.marketwatch.com/historical/default.asp?detect=1&symbol=DJIA&close_date=10%2F29%2F09&x=0&y=0 [10/29/10]
10 - bigcharts.marketwatch.com/historical/default.asp?detect=1&symbol=COMP&close_date=10%2F29%2F09&x=0&y=0 [10/29/10]
10 - bigcharts.marketwatch.com/historical/default.asp?detect=1&symbol=SPX&close_date=10%2F29%2F09&x=0&y=0 [10/29/10]
10 - bigcharts.marketwatch.com/historical/default.asp?detect=1&symbol=DJIA&close_date=10%2F28%2F05&x=0&y=0 [10/29/10]
10 - bigcharts.marketwatch.com/historical/default.asp?detect=1&symbol=COMP&close_date=10%2F28%2F05&x=0&y=0 [10/29/10]
10 - bigcharts.marketwatch.com/historical/default.asp?detect=1&symbol=SPX&close_date=10%2F28%2F05&x=0&y=0 [10/29/10]
10 - bigcharts.marketwatch.com/historical/default.asp?detect=1&symbol=DJIA&close_date=10%2F30%2F00&x=0&y=0 [10/29/10]
10 - bigcharts.marketwatch.com/historical/default.asp?detect=1&symbol=COMP&close_date=10%2F30%2F00&x=0&y=0 [10/29/10]
10 - bigcharts.marketwatch.com/historical/default.asp?detect=1&symbol=SPX&close_date=10%2F30%2F00&x=0&y=0 [10/29/10]
11 - ustreas.gov/offices/domestic-finance/debt-management/interest-rate/real_yield.shtml [10/29/10]
11 - ustreas.gov/offices/domestic-finance/debt-management/interest-rate/real_yield_historical.shtml [10/29/10]
12 - treasurydirect.gov/instit/annceresult/press/preanre/2000/ofm11200.pdf [7/12/00]

This material was prepared by Peter Montoya Inc., and does not necessarily represent the views of the presenting Representative or the Representative’s Broker/Dealer. This information should not be construed as investment advice. The Dow Jones Industrial Average is a price-weighted index of 30 actively traded blue-chip stocks. The NASDAQ Composite Index is an unmanaged, market-weighted index of all over-the-counter common stocks traded on the National Association of Securities Dealers Automated Quotation System. The Standard & Poor's 500 (S&P 500) is an unmanaged group of securities considered to be representative of the stock market in general. It is not possible to invest directly in an index. NYSE Group, Inc. (NYSE:NYX) operates two securities exchanges: the New York Stock Exchange (the “NYSE”) and NYSE Arca (formerly known as the Archipelago Exchange, or ArcaEx®, and the Pacific Exchange). NYSE Group is a leading provider of securities listing, trading and market data products and services. The New York Mercantile Exchange, Inc. (NYMEX) is the world's largest physical commodity futures exchange and the preeminent trading forum for energy and precious metals, with trading conducted through two divisions – the NYMEX Division, home to the energy, platinum, and palladium markets, and the COMEX Division, on which all other metals trade. All information is believed to be from reliable sources; however we make no representation as to its completeness or accuracy. All economic and performance data is historical and not indicative of future results. Market indices discussed are unmanaged. Investors cannot invest in unmanaged indices. The publisher is not engaged in rendering legal, accounting or other professional services. If other expert assistance is needed, the reader is advised to engage the services of a competent professional. Please consult your Financial Advisor for further information. Additional risks are associated with international investing, such as currency fluctuations, political and economic instability and differences in accounting standards. www.montoyaregistry.com www.petermontoya.com

October 25, 2010 Weekly Market Commentary

FED & CONFERENCE BOARD SEE MODEST GROWTH
The Federal Reserve’s latest Beige Book came out last week, and 8 of the 12 regional Fed banks reported economic expansion in the anecdotal survey covering September and early October. The survey found that while hiring demand “remained limited”, gains in manufacturing and retail spending were occurring in most regions. The Conference Board’s September Leading Indicators Index offered a slightly less encouraging picture – the gauge advanced for a third consecutive month, rising 0.3%, but just 5 of the 10 components of the index posted gains.1,2

HOUSING STARTS RISE SLIGHTLY
A nice surprise: Commerce Department data showed a 0.3% advance in housing starts for September. Analysts were not expecting a third straight monthly increase. Is it a sign of stability in the real estate market? Economists hope so, though the pace of housing starts is still very weak in historical terms.3

INDUSTRIAL OUTPUT DISAPPOINTS
It had been a year since the Federal Reserve announced a monthly decline in industrial production. There was an unanticipated 0.2% drop in the category for September. Utilities production rose by 1.9%.4

GOLD PULLS BACK, OIL HOLDS STEADY
October 18-22 was the worst week in three months for the precious metal, which had been heading north toward the $1,400 mark at mid-month. Gold futures fell 3.41% last week, resulting in a $1,324.40 close Friday on the COMEX. Crude oil futures dipped 0.29% last week to settle at $81.69 per barrel on the NYMEX Friday.5

GAINS ON WALL STREET
Marquee U.S. indices pulled off small advances last week. The Dow rose 0.63% to a Friday close of 11,132.56. The NASDAQ and S&P 500 respectively gained 0.43% and 0.59% on the week; at Friday’s closing bell, that left them at 2,479.39 and 1,183.08.6


COMING NEXT WEEK: September existing home sales (Monday), the August Case-Shiller Home Price Index and the Conference Board’s October poll of consumer confidence (Tuesday), September new home sales and durable goods orders (Wednesday), the latest initial and continuing claims (Thursday), and the final October reading on consumer sentiment from the University of Michigan and the first estimate of 3Q GDP (Friday). Plus of course, 3Q earnings reports all week.

Best Regards,

Kevin Kroskey

Bookmark and Share


Citations.
1 – dailyfinance.com/story/the-fed-economy-grew-at-a-modest-pace-in-september/19681630/ [10/20/10]
2 – msnbc.msn.com/id/39777205/ns/business-eye_on_the_economy/ [10/21/10]
3 – marketwatch.com/story/housing-starts-rise-03-to-610000-in-september-2010-10-19 [10/19/10]
4 - thestreet.com/story/10891354/1/industrial-production-drops-in-september.html [10/18/10]
5 - blogs.wsj.com/marketbeat/2010/10/22/data-points-energy-metals-386/ [10/22/10]
6 – cnbc.com/id/39801554 [10/22/10]
7 - bigcharts.marketwatch.com/historical/default.asp?detect=1&symbol=DJIA&close_date=10%2F22%2F09&x=0&y=0 [10/22/10]
7 - bigcharts.marketwatch.com/historical/default.asp?detect=1&symbol=COMP&close_date=10%2F22%2F09&x=0&y=0 [10/22/10]
7 - bigcharts.marketwatch.com/historical/default.asp?detect=1&symbol=SPX&close_date=10%2F22%2F09&x=0&y=0 [10/22/10]
7 - bigcharts.marketwatch.com/historical/default.asp?detect=1&symbol=DJIA&close_date=10%2F21%2F05&x=0&y=0 [10/22/10]
7 - bigcharts.marketwatch.com/historical/default.asp?detect=1&symbol=COMP&close_date=10%2F21%2F05&x=0&y=0 [10/22/10]
7 - bigcharts.marketwatch.com/historical/default.asp?detect=1&symbol=SPX&close_date=10%2F21%2F05&x=0&y=0 [10/22/10]
7 - bigcharts.marketwatch.com/historical/default.asp?detect=1&symbol=DJIA&close_date=10%2F23%2F00&x=0&y=0 [10/22/10]
7 - bigcharts.marketwatch.com/historical/default.asp?detect=1&symbol=COMP&close_date=10%2F23%2F00&x=0&y=0 [10/22/10]
7 - bigcharts.marketwatch.com/historical/default.asp?detect=1&symbol=SPX&close_date=10%2F23%2F00&x=0&y=0 [10/22/10]
8 - ustreas.gov/offices/domestic-finance/debt-management/interest-rate/real_yield.shtml [10/22/10]
8 - ustreas.gov/offices/domestic-finance/debt-management/interest-rate/real_yield_historical.shtml [10/22/10]
9 - treasurydirect.gov/instit/annceresult/press/preanre/2000/ofm11200.pdf [7/12/00]


This material was prepared by Peter Montoya Inc., and does not necessarily represent the views of the presenting Representative or the Representative’s Broker/Dealer. This information should not be construed as investment advice. The Dow Jones Industrial Average is a price-weighted index of 30 actively traded blue-chip stocks. The NASDAQ Composite Index is an unmanaged, market-weighted index of all over-the-counter common stocks traded on the National Association of Securities Dealers Automated Quotation System. The Standard & Poor's 500 (S&P 500) is an unmanaged group of securities considered to be representative of the stock market in general. It is not possible to invest directly in an index. NYSE Group, Inc. (NYSE:NYX) operates two securities exchanges: the New York Stock Exchange (the “NYSE”) and NYSE Arca (formerly known as the Archipelago Exchange, or ArcaEx®, and the Pacific Exchange). NYSE Group is a leading provider of securities listing, trading and market data products and services. The New York Mercantile Exchange, Inc. (NYMEX) is the world's largest physical commodity futures exchange and the preeminent trading forum for energy and precious metals, with trading conducted through two divisions – the NYMEX Division, home to the energy, platinum, and palladium markets, and the COMEX Division, on which all other metals trade. All information is believed to be from reliable sources; however we make no representation as to its completeness or accuracy. All economic and performance data is historical and not indicative of future results. Market indices discussed are unmanaged. Investors cannot invest in unmanaged indices. The publisher is not engaged in rendering legal, accounting or other professional services. If other expert assistance is needed, the reader is advised to engage the services of a competent professional. Please consult your Financial Advisor for further information. Additional risks are associated with international investing, such as currency fluctuations, political and economic instability and differences in accounting standards. www.montoyaregistry.com http://www.petermontoya.com/

October 18, 2010 Weekly Market Commentary

The Markets

When is a dollar not worth a dollar?

A McDonald’s Big Mac costs an average of $3.71 in the United States, according to an October 14 article from The Economist. Just across the border in Canada, that same burger costs $4.18 based on the October 13 exchange rate. In the Euro area, you’d have to shell out $4.79 to quench your Mac attack. But, if you’re really hungry, you should forget going to Switzerland because a Big Mac there will set you back a whopping $6.78 at the going exchange rate.

So, a dollar is not worth a dollar when its value declines relative to another country’s currency such as the ones above. The dollar is also weak against the Japanese yen, where it fell to a 15-year low last week, and the Australian dollar, where it fell to a nearly 30-year low, according to MarketWatch.

What’s going on here?

Essentially, the combination of economic weakness in the U.S., extremely low interest rates, and our country’s easy money policy, have conspired to reduce the value of our currency relative to some other countries. And, as our government knows, a weak currency can be a net positive -- as long as it doesn’t get too weak.

According to an October 1 weekly update from Linda Duessel at Federated Investors, “Currency depreciation is the most politically palatable way to deal with both deficits and slow growth. Unfortunately, history suggests depreciating the dollar is the worst possible way to deal with public debt. It spawns inflation, stifles growth and eats away at earnings.”

The relatively weak value of the dollar may not crimp your day-to-day lifestyle right now. However, as an advisor, it’s an important macro indicator that could impact the value of your portfolio -- and your pocketbook -- if it gets too far outside of historical norms. It bears watching.

(Click on the picture below to enlarge the table in a new window.)


WHILE THE PURCHASING POWER OF THE DOLLAR can be analyzed using a Big Mac, it can also be analyzed using something less edible -- gold. Gold has been considered a medium of exchange for several thousand years, according to the National Mining Association. And, for some people, it is the soundest “currency” in existence today because it is scarce, it can’t be printed (mined) freely, and it has a long history of being valuable and tradable even though it generally has zero commercial use other than for jewelry.

Measuring the value of the dollar in terms of gold is quite simple. All you do is plot the dollar cost of one ounce of gold over time. Back in the early 1930s when our country was on the gold standard, gold was set at a fixed price of $20.67 per ounce, according to The Economist. In the early 1970s, the last vestiges of the gold standard were removed and the price of gold was allowed to reach a “market” price. As of last week, that market price was over $1,300 per ounce.

The rise of gold from $20 an ounce to over $1,300 an ounce was effectively a massive devaluation of the dollar, according to The Economist. Had you bought an ounce of gold in 1930 for $20 and held it to today, you could sell it for more than $1,300, which is a return moderately above inflation over the timer period. However, dad you just sat on your $20, it would still be worth $20, but it would buy you less than 1/50th of an ounce of gold.

The funny thing about gold is that it’s not an “investment” in the traditional sense because it does not pay a dividend and it does not generate cash flow. It just sits there and looks really pretty. I would say it's more of a speculation than an investment given its characteristics. And for those gold bugs, gold is still markedly below it's inflation-adjusted high reached in the 1980s and did virtually nothing for 20 long years. It's just the 'speculation du jour' because it has recently done well.

Weekly Focus – Think About It

“More gold has been mined from the thoughts of men than has been taken from the earth.”
--Napoleon Hill

Best regards,

Kevin Kroskey

Bookmark and Share


* The Standard & Poor's 500 (S&P 500) is an unmanaged group of securities considered to be representative of the stock market in general.
* The DJ Global ex US is an unmanaged group of non-U.S. securities designed to reflect the performance of the global equity securities that have readily available prices.
* The 10-year Treasury Note represents debt owed by the United States Treasury to the public. Since the U.S. Government is seen as a risk-free borrower, investors use the 10-year Treasury Note as a benchmark for the long-term bond market.
* Gold represents the London afternoon gold price fix as reported by the London Bullion Market Association.
* The DJ Commodity Index is designed to be a highly liquid and diversified benchmark for the commodity futures market. The Index is composed of futures contracts on 19 physical commodities and was launched on July 14, 1998.
* The DJ Equity All REIT TR Index measures the total return performance of the equity subcategory of the Real Estate Investment Trust (REIT) industry as calculated by Dow Jones.
* Yahoo! Finance is the source for any reference to the performance of an index between two specific periods.
* Opinions expressed are subject to change without notice and are not intended as investment advice or to predict future performance.
* Past performance does not guarantee future results.
* You cannot invest directly in an index.
* Consult your financial professional before making any investment decision.
* This newsletter was prepared by PEAK.

Future Posts at www.TrueWealthDesign.com

Any future blog posts will be done at www.TrueWealthDesign.com . Thank you, Kevin Kroskey, CFP, MBA