February 14, 2011 Weekly Market Commentary

AN END IN SIGHT FOR FANNIE & FREDDIE
Friday, the Obama administration presented a plan to wind down Fannie Mae and Freddie Mac by 2018, with Treasury Secretary Timothy Geithner citing “very broad consensus” that the government should play “a much smaller role” in the housing market. So what will replace them? The plan puts three options before Congress. In one option, the government would leave the mortgage market save for the VHA, FHA and other existing agencies. Two other options would set up “re-insurance” programs. A limited version would guarantee private mortgages only in economic or real estate downturns; another would provide a backstop for mortgage investments already guaranteed by private insurers. All three options would pave the way for higher mortgage costs. The Treasury and HUD have also suggested phasing in a short-term requirement for borrowers as Fannie and Freddie are unwound: homebuyers would have to put 10% down for any mortgage backed by the GSEs.1,2

CONSUMERS FEEL MORE UPBEAT
The latest Reuters/University of Michigan consumer sentiment survey is in, and the initial February reading is 75.1, an improvement from the final January mark of 74.2. This is the best reading since June 2009. The survey’s current conditions index rose 5.0% to 86.8 – the highest it has been in 37 months.3

GOLD ADVANCES, OIL PULLS BACK
Gold prices climbed 0.86% last week to settle at $1,359.90 an ounce Friday – it was the best week for the precious metal YTD. Oil and natural gas prices fell to their lowest levels since November on Friday after Egyptian president Hosni Mubarak announced his resignation; natural gas futures fell 9.28% on the week, and oil slipped 3.88% for the week to settle at $85.58 per barrel on the NYMEX.4

DJIA CLOSES AT HIGHEST MARK SINCE 6/16/08
The Dow logged an eight-day winning streak from January 31 to February 9, and it has advanced in 10 of the past 11 weeks. The weekly performance? DJIA, +1.50% to 12,273.26; NASDAQ, +1.45% to 2,809.44; S&P 500, +1.39% to 1,329.15.5

THIS WEEK: Very little is scheduled for either Monday or Friday. Tuesday brings January retail sales numbers and a report on December business inventories, plus 4Q earnings from Dell, Barclays and Tesla. Wednesday offers the January Producer Price Index, the most recent FOMC minutes, reports on January housing starts and industrial output and 4Q results from Comcast and CBS. Thursday, we get the January Consumer Price Index, the Conference Board’s latest LEI, new initial claims numbers and earnings from Nordstrom.


WEEKLY QUOTE
“The spirit, the will to win, and the will to excel are the things that endure. These qualities are so much more important than the events that occur.”
– Vince Lombardi

WEEKLY TIP
Students who want to enter college this fall should complete the FAFSA early in 2011 to increase eligibility for student aid. After completing it, they should apply for scholarships as soon as possible.

Best Regards,

Kevin Kroskey

Bookmark and Share

Citations.

1 - blogs.abcnews.com/george/2011/02/the-end-of-fannie-mae-and-freddie-mac.html [2/11/11]
2 - cnbc.com/id/41529671 [2/11/11]
3 - marketwatch.com/story/us-consumer-sentiment-rises-in-february-2011-02-11 [2/11/11]
4 - blogs.wsj.com/marketbeat/2011/02/11/data-points-energy-metals-459/ [2/11/11]
5 - cnbc.com/id/41537483 [2/11/11]
6 - bigcharts.marketwatch.com/historical/default.asp?detect=1&symbol=DJIA&close_date=2%2F11%2F10&x=0&y=0 [2/11/11]
6 - bigcharts.marketwatch.com/historical/default.asp?detect=1&symbol=COMP&close_date=2%2F11%2F10&x=0&y=0 [2/11/11]
6 - bigcharts.marketwatch.com/historical/default.asp?detect=1&symbol=SPX&close_date=2%2F11%2F10&x=0&y=0 [2/11/11]
6 - bigcharts.marketwatch.com/historical/default.asp?detect=1&symbol=DJIA&close_date=2%2F10%2F06&x=0&y=0 [2/11/11]
6 - bigcharts.marketwatch.com/historical/default.asp?detect=1&symbol=COMP&close_date=2%2F10%2F06&x=0&y=0 [2/11/11]
6 - bigcharts.marketwatch.com/historical/default.asp?detect=1&symbol=SPX&close_date=2%2F10%2F06&x=0&y=0 [2/11/11]
6 - bigcharts.marketwatch.com/historical/default.asp?detect=1&symbol=DJIA&close_date=2%2F12%2F01&x=0&y=0 [2/11/11]
6 - bigcharts.marketwatch.com/historical/default.asp?detect=1&symbol=COMP&close_date=2%2F12%2F01&x=0&y=0 [2/11/11]
6 - bigcharts.marketwatch.com/historical/default.asp?detect=1&symbol=SPX&close_date=2%2F12%2F01&x=0&y=0 [2/11/11]
7 - treasury.gov/resource-center/data-chart-center/interest-rates/Pages/TextView.aspx?data=realyield [2/11/11]
7 - treasury.gov/resource-center/data-chart-center/interest-rates/Pages/TextView.aspx?data=realyieldAll [2/11/11]
8 - treasurydirect.gov/instit/annceresult/press/preanre/2001/ofm11001.pdf [1/10/01]
9 - http://montoyaregistry.com/Financial-Market.aspx?financial-market=wills-and-living-trusts&category=30 [2/13/11]


This material was prepared by Peter Montoya Inc., and does not necessarily represent the views of the presenting party, nor their affiliates. This information should not be construed as investment, tax or legal advice. The Dow Jones Industrial Average is a price-weighted index of 30 actively traded blue-chip stocks. The NASDAQ Composite Index is an unmanaged, market-weighted index of all over-the-counter common stocks traded on the National Association of Securities Dealers Automated Quotation System. The Standard & Poor's 500 (S&P 500) is an unmanaged group of securities considered to be representative of the stock market in general. It is not possible to invest directly in an index. NYSE Group, Inc. (NYSE:NYX) operates two securities exchanges: the New York Stock Exchange (the “NYSE”) and NYSE Arca (formerly known as the Archipelago Exchange, or ArcaEx®, and the Pacific Exchange). NYSE Group is a leading provider of securities listing, trading and market data products and services. The New York Mercantile Exchange, Inc. (NYMEX) is the world's largest physical commodity futures exchange and the preeminent trading forum for energy and precious metals, with trading conducted through two divisions – the NYMEX Division, home to the energy, platinum, and palladium markets, and the COMEX Division, on which all other metals trade. Additional risks are associated with international investing, such as currency fluctuations, political and economic instability and differences in accounting standards. All information is believed to be from reliable sources; however we make no representation as to its completeness or accuracy. All economic and performance data is historical and not indicative of future results. Market indices discussed are unmanaged. Investors cannot invest in unmanaged indices. The publisher is not engaged in rendering legal, accounting or other professional services. If assistance is needed, the reader is advised to engage the services of a competent professional.

January 31, 2011 Weekly Market Commentary

4Q GDP: +3.2%
The preliminary estimate from the Bureau of Economic Analysis certainly beats the +2.6% mark from 3Q 2010. A deeper look into the BEA report reveals both personal consumption and nonresidential fixed investment improving by a healthy 4.4% last quarter; inventory accumulation slowed as well.1

HUGE JUMP IN NEW HOME SALES
The pace of new home sales improved by 17.5% last month, according to the Census Bureau. In year-over-year terms, sales were down 7.6% while sale prices were 9.1% better. For the record, fewer new homes were built in 2010 than in any year since the government started keeping records in 1963. In other housing news, the National Association of Realtors reported that pending home sales were up for the fifth time in the last six months in December (+2.0%), and Freddie Mac reported that the average interest rate on a 30-year conventional mortgage has risen to 4.80%.2,3

DISSIMILAR FINDINGS FROM CONFIDENCE POLLS
While the Conference Board’s January poll showed U.S. consumer confidence at an 8-month peak (60.6), the final January Reuters/University of Michigan survey showed a slight decline to 74.2 from 74.5 in December.4,5

DURABLE GOODS ORDERS DOWN 2.5%
There was a silver lining in the Commerce Department’s December report: with aircraft orders factored out, durable goods orders were up 0.5% last month.6

FEARS, EARNINGS REPORTS STAGGER STOCKS
Unrest in Egypt (and subpar 4Q results from Ford, Amazon and Microsoft) led to a lot of selling Friday and took the DJIA, S&P 500 and NASDAQ lower for the week. The Dow’s eight-week winning streak was snapped; it did top 12,000 in intraday trading Friday. Weekly performances were as follows: DJIA, -0.41% to 11,823.70; S&P 500, -0.55% to 1,276.34; NASDAQ, -0.10% to 2,686.89. The CBOE VIX gained 8.50% last week.7

THIS WEEK: Monday brings a new consumer spending report and earnings from ExxonMobil and Chrysler. Tuesday, we have the January ISM manufacturing report and earnings from BP, Pfizer, UPS and Broadcom. Wednesday we get 4Q results from Yum Brands, Visa and Mattel. Thursday brings new initial and continuing claims data, a new ISM service sector report, December factory orders data, and 4Q results from Merck, Sony and Unilever and Ben Bernanke speaking to the National Press Club. Friday, we have the January jobs report and Aetna’s 4Q earnings.


WEEKLY QUOTE
“You can’t judge right from looking at what’s wrong.”
– Bo Diddley

WEEKLY TIP
A tax refund is nice, but it also means that you’ve given the IRS an interest-free loan. You may want to adjust your W-4 form so less is withheld from your paycheck. Maybe that extra money could be put to better use throughout the year - in your IRA or 401(k) for example.

Best Regards,
Kevin Kroskey
Bookmark and Share

Citations.
1 - blogs.forbes.com/afontevecchia/2011/01/28/inflation-wary-consumers-help-economy-grow-3-2-in-q4/ [1/28/11]
2 - latimes.com/business/realestate/la-fi-home-sales-20110127,0,3555076.story [1/27/11]
3 - usatoday.com/money/economy/housing/2011-01-27-pending-home-sales_N.htm [1/27/11]
4 - latimesblogs.latimes.com/money_co/2011/01/consumer-confidence-index-rises-job-market-outlook.html [1/25/11]
5 - marketwatch.com/story/us-consumers-sentiment-dips-in-january-2011-01-28 [1/28/11]
6 - abcnews.go.com/Business/wireStory?id=12779327 [1/27/11]
7 - cnbc.com/id/41317519 [1/28/11]
8 - bigcharts.marketwatch.com/historical/default.asp?detect=1&symbol=DJIA&close_date=1%2F28%2F10&x=0&y=0 [1/28/11]
8 - bigcharts.marketwatch.com/historical/default.asp?detect=1&symbol=COMP&close_date=1%2F28%2F10&x=0&y=0 [1/28/11]
8 - bigcharts.marketwatch.com/historical/default.asp?detect=1&symbol=SPX&close_date=1%2F28%2F10&x=0&y=0 [1/28/11]
8 - bigcharts.marketwatch.com/historical/default.asp?detect=1&symbol=DJIA&close_date=1%2F27%2F06&x=0&y=0 [1/28/11]
8 - bigcharts.marketwatch.com/historical/default.asp?detect=1&symbol=COMP&close_date=1%2F27%2F06&x=0&y=0 [1/28/11]
8 - bigcharts.marketwatch.com/historical/default.asp?detect=1&symbol=SPX&close_date=1%2F27%2F06&x=0&y=0 [1/28/11]
8 - bigcharts.marketwatch.com/historical/default.asp?detect=1&symbol=DJIA&close_date=1%2F7%29F01&x=0&y=0 [1/28/11]
8 - bigcharts.marketwatch.com/historical/default.asp?detect=1&symbol=COMP&close_date=1%2F7%29F01&x=0&y=0 [1/28/11]
8 - bigcharts.marketwatch.com/historical/default.asp?detect=1&symbol=SPX&close_date=1%2F7%29F01&x=0&y=0 [1/28/11]
9 - treasury.gov/resource-center/data-chart-center/interest-rates/Pages/TextView.aspx?data=realyield [1/28/11]
9 - treasury.gov/resource-center/data-chart-center/interest-rates/Pages/TextView.aspx?data=realyieldAll [1/28/11]
10 - treasurydirect.gov/instit/annceresult/press/preanre/2001/ofm11001.pdf [1/10/01]
11 - montoyaregistry.com/Financial-Market.aspx?financial-market=an-introduction-to-the-stock-market&category=29 [1/29/11]


This material was prepared by Peter Montoya Inc., and does not necessarily represent the views of the presenting party, nor their affiliates. This information should not be construed as investment, tax or legal advice. The Dow Jones Industrial Average is a price-weighted index of 30 actively traded blue-chip stocks. The NASDAQ Composite Index is an unmanaged, market-weighted index of all over-the-counter common stocks traded on the National Association of Securities Dealers Automated Quotation System. The Standard & Poor's 500 (S&P 500) is an unmanaged group of securities considered to be representative of the stock market in general. It is not possible to invest directly in an index. NYSE Group, Inc. (NYSE:NYX) operates two securities exchanges: the New York Stock Exchange (the “NYSE”) and NYSE Arca (formerly known as the Archipelago Exchange, or ArcaEx®, and the Pacific Exchange). NYSE Group is a leading provider of securities listing, trading and market data products and services. The New York Mercantile Exchange, Inc. (NYMEX) is the world's largest physical commodity futures exchange and the preeminent trading forum for energy and precious metals, with trading conducted through two divisions – the NYMEX Division, home to the energy, platinum, and palladium markets, and the COMEX Division, on which all other metals trade. Additional risks are associated with international investing, such as currency fluctuations, political and economic instability and differences in accounting standards. All information is believed to be from reliable sources; however we make no representation as to its completeness or accuracy. All economic and performance data is historical and not indicative of future results. Market indices discussed are unmanaged. Investors cannot invest in unmanaged indices. The publisher is not engaged in rendering legal, accounting or other professional services. If assistance is needed, the reader is advised to engage the services of a competent professional.

January 17, 2011 Weekly Market Commentary

CONSUMER & PRODUCER PRICES RISE
The U.S. inflation rate hit an 18-month peak in December: the federal government’s Consumer Price Index advanced 0.5%. Pump prices were a big factor in that gain: gasoline grew 8.5% more expensive last month. However, core CPI (minus food and energy prices) only rose 0.1% for the month, and consumers experienced just 1.5% inflation across 2010. The Producer Price Index went 1.1% higher in December, and energy costs were responsible for most of the gain. Core PPI (again, minus food and energy prices) was just +0.2% for December. Wholesale prices rose 4.0% in 2010.1,2,3

ENCOURAGING RETAIL SALES FIGURES RELEASED
The Commerce Department announced a 0.6% gain in retail sales for December. While this was smaller than the 0.8% advance forecast by economists polled by MarketWatch, the increase wrapped up a positive year for the indicator. Retail sales have now improved for sixth months in a row, and 2010 was the best year for the category since 1999.4

GOLD SLIDES, BUT OIL RECOVERS
Gold is certainly off to a rocky start in 2011: as of Friday’s COMEX close, it was down 4.27% YTD to $1360.40 per ounce following news that China had tightened bank reserves. Oil, on the other hand, gained 3.99% last week to settle Friday at $91.54 a barrel on the NYMEX with prices up +0.18% YTD.5

NEWEST UNIV. OF MICHIGAN POLL UNDERWHELMS
The initial Reuters/University of Michigan consumer sentiment survey for January showed a little slip in consumer sentiment. It came in at 72.7, down from 74.4 at the end of 2010. Economists polled by Bloomberg News had reached a consensus forecast of 75.5.6

TWO WINNING WEEKS IN A ROW TO START 2011
A strong Friday contributed to nice weekly advances for the three major U.S. indices. The weekly numbers: DJIA, +0.96% to 11,787.38; NASDAQ, +1.93% to 2755.30; S&P 500, +1.71% to 1293.24. At Friday’s close, the S&P was at its highest level since August 28, 2008.7

THIS WEEK: Stock markets are closed Monday for the national holiday honoring Dr. Martin Luther King, Jr. Looking at the notable economic releases next week, we get data on December housing starts and building permits on Wednesday, and a look at December existing home sales, the latest index of leading indicators from the Conference Board and the latest initial and continuing claims reports on Thursday.


WEEKLY QUOTE
“Knowledge is more than equivalent to force.”
– Samuel Johnson

WEEKLY TIP
Do you have credit cards? Did you know you can call your credit card company and request a lower interest rate? In fact, a good rule of thumb is to do this once every six months. They don't grant every request, but you won't know if you don't ask.

Best Regards,

Kevin Kroskey

Bookmark and Share


Citations.
1- bls.gov/news.release/cpi.nr0.htm [1/14/11]
2 - theatlantic.com/business/archive/2011/01/consumer-price-inflation-jumps-05-in-december/69567/ [1/14/11]
3 - npr.org/blogs/thetwo-way/2011/01/13/132886429/jobless-claims-jump-up-energy-pushed-wholesale-prices-higher [1/13/11]
4 - marketwatch.com/story/us-retail-sales-climb-06-in-december-2011-01-14 [1/14/11]
5 - blogs.wsj.com/marketbeat/2011/01/14/data-points-energy-metals-440/ [1/14/11]
6 - bloomberg.com/news/2011-01-14/u-s-consumer-confidence-unexpectedly-declines-on-jobless-rate-fuel-costs.html [1/14/11]
7 - cnbc.com/id/41080629 [1/14/11]
8 - bigcharts.marketwatch.com/historical/default.asp?detect=1&symbol=DJIA&close_date=1%2F14%2F10&x=0&y=0 [1/14/11]
8 - bigcharts.marketwatch.com/historical/default.asp?detect=1&symbol=COMP&close_date=1%2F14%2F10&x=0&y=0 [1/14/11]
8 - bigcharts.marketwatch.com/historical/default.asp?detect=1&symbol=SPX&close_date=1%2F14%2F10&x=0&y=0 [1/14/11]
8 - bigcharts.marketwatch.com/historical/default.asp?detect=1&symbol=DJIA&close_date=1%2F13%2F06&x=0&y=0 [1/14/11]
8 - bigcharts.marketwatch.com/historical/default.asp?detect=1&symbol=COMP&close_date=1%2F13%2F06&x=0&y=0 [1/14/11]
8 - bigcharts.marketwatch.com/historical/default.asp?detect=1&symbol=SPX&close_date=1%2F13%2F06&x=0&y=0 [1/14/11]
8 - bigcharts.marketwatch.com/historical/default.asp?detect=1&symbol=DJIA&close_date=1%2F12%2F01&x=0&y=0 [1/14/11]
8 - bigcharts.marketwatch.com/historical/default.asp?detect=1&symbol=COMP&close_date=1%2F12%2F01&x=0&y=0 [1/14/11]
8 - bigcharts.marketwatch.com/historical/default.asp?detect=1&symbol=SPX&close_date=1%2F7%12F01&x=0&y=0 [1/14/11]
9 - treasury.gov/resource-center/data-chart-center/interest-rates/Pages/TextView.aspx?data=realyield [1/14/11]
9 - treasury.gov/resource-center/data-chart-center/interest-rates/Pages/TextView.aspx?data=realyieldAll [1/14/11]
10 - treasurydirect.gov/instit/annceresult/press/preanre/2001/ofm11001.pdf [1/10/01]


This material was prepared by Peter Montoya Inc., and does not necessarily represent the views of the presenting party, nor their affiliates. This information should not be construed as investment, tax or legal advice. The Dow Jones Industrial Average is a price-weighted index of 30 actively traded blue-chip stocks. The NASDAQ Composite Index is an unmanaged, market-weighted index of all over-the-counter common stocks traded on the National Association of Securities Dealers Automated Quotation System. The Standard & Poor's 500 (S&P 500) is an unmanaged group of securities considered to be representative of the stock market in general. It is not possible to invest directly in an index. NYSE Group, Inc. (NYSE:NYX) operates two securities exchanges: the New York Stock Exchange (the “NYSE”) and NYSE Arca (formerly known as the Archipelago Exchange, or ArcaEx®, and the Pacific Exchange). NYSE Group is a leading provider of securities listing, trading and market data products and services. The New York Mercantile Exchange, Inc. (NYMEX) is the world's largest physical commodity futures exchange and the preeminent trading forum for energy and precious metals, with trading conducted through two divisions – the NYMEX Division, home to the energy, platinum, and palladium markets, and the COMEX Division, on which all other metals trade. Additional risks are associated with international investing, such as currency fluctuations, political and economic instability and differences in accounting standards. All information is believed to be from reliable sources; however we make no representation as to its completeness or accuracy. All economic and performance data is historical and not indicative of future results. Market indices discussed are unmanaged. Investors cannot invest in unmanaged indices. The publisher is not engaged in rendering legal, accounting or other professional services. If assistance is needed, the reader is advised to engage the services of a competent professional.
January 3, 2011 Weekly Market Commentary

MAJOR INDICES POST DOUBLE-DIGIT GAINS IN 2010
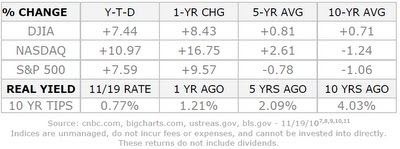
For the second year in a row, bulls ruled Wall Street. When the closing bell sounded on December 31, the S&P 500 was at 1,257.64, having gained 12.78% for 2010. The Dow finished 2010 at 11,577.51, representing an 11.02% year-over-year advance. The NASDAQ wrapped up 2010 at 2,652.87, posting a 16.91% yearly gain. The Russell 2000 also had a terrific year, finishing +25.31% after going +7.79% for December.1

FEWER INITIAL CLAIMS … AND LESS CONFIDENCE?
While the University of Michigan’s final December consumer sentiment survey showed consumer confidence at a 6-month peak, the Conference Board’s December poll declined to a 52.5 reading. Perhaps as RBS Securities Inc. economist Omair Sharif noted at Bloomberg.com, “we should watch what consumers do and not what they say.” Here’s a development that might improve consumer sentiment: weekly jobless claims dropped to a 2-year low in the week that ended Christmas Day. The 388,000 initial claims filed that week were the smallest number since July 2008.2,3

IMPROVED PENDING HOME SALES
The National Association of Realtors reported a 3.5% increase in the category for November. NAR’s pending home sales index still came in 5.0% below its November 2009 mark, but this was the second straight monthly improvement.4

CASE-SHILLER: HOME PRICES DOWN 0.8%
The latest Standard & Poor's/Case-Shiller home price index shows an 0.8% decline in housing prices across 20 cities from October 2009 to October 2010. A 1.0% overall decline in prices last October contributed to the year-over-year retreat.5

OIL, GOLD & COPPER OUTPACE STOCKS
Gold prices rose 29.76% on the COMEX in 2010. That is the best year for gold since 2007; the precious metal climbed $41.10 last week to finish December at $1,421.10 per ounce. Oil futures went +14.27% in the fourth quarter to finish the year up 15.15% at $91.38 a barrel. Copper gained 33.42% in 2010, concluding the year at $4.44 per pound.6

COMING THIS WEEK: Monday brings the Institute for Supply Management’s December manufacturing report and data on November construction spending. Tuesday, we get data on November factory orders, the most recent FOMC minutes and new estimates of auto and truck sales. Wednesday brings the ISM December service sector report. Thursday, we have new initial and continuing claims numbers. Friday, we get the December unemployment report from the Labor Department.


WEEKLY QUOTE
“And as we let our own light shine, we unconsciously give other people permission to do the same.”
– Nelson Mandela

WEEKLY TIP
Here’s a question for 2011: how are your current lifestyle costs affecting your financial progress? Consider emulating the “millionaire next door” - spend less today and you may end up with more money to save and invest toward lifetime financial objectives.

Best Regards,

Kevin Kroskey

Bookmark and Share


Citations.
1 - cnbc.com/id/40865401 [12/31/10]
2 - bloomberg.com/news/2010-12-28/consumer-confidence-in-u-s-unexpectedly-falls-on-outlook-for-job-market.html [12/28/10]
3 - marketwatch.com/story/weekly-jobless-claims-drop-below-400000-2010-12-30?dist=afterbell [12/30/10]
4 - realtor.org/press_room/news_releases/2010/12/pending_gradual [12/30/10]
5 - reuters.com/article/idUSN2824569820101228 [12/28/10]
6 - blogs.wsj.com/marketbeat/2010/12/31/data-points-energy-metals-430/ [12/31/10]
7 - bigcharts.marketwatch.com/historical/default.asp?detect=1&symbol=DJIA&close_date=12%2F31%2F09&x=0&y=0 [12/31/10]
7 - bigcharts.marketwatch.com/historical/default.asp?detect=1&symbol=COMP&close_date=12%2F31%2F09&x=0&y=0 [12/31/10]
7 - bigcharts.marketwatch.com/historical/default.asp?detect=1&symbol=SPX&close_date=12%2F31%2F09&x=0&y=0 [12/31/10]
7 - bigcharts.marketwatch.com/historical/default.asp?detect=1&symbol=DJIA&close_date=12%2F30%2F05&x=0&y=0 [12/31/10]
7 - bigcharts.marketwatch.com/historical/default.asp?detect=1&symbol=COMP&close_date=12%2F30%2F05&x=0&y=0 [12/31/10]
7 - bigcharts.marketwatch.com/historical/default.asp?detect=1&symbol=SPX&close_date=12%2F30%2F05&x=0&y=0 [12/31/10]
7 - bigcharts.marketwatch.com/historical/default.asp?detect=1&symbol=DJIA&close_date=12%2F22%2F00&x=0&y=0 [12/31/10]
7 - bigcharts.marketwatch.com/historical/default.asp?detect=1&symbol=COMP&close_date=12%2F22%2F00&x=0&y=0 [12/31/10]
7 - bigcharts.marketwatch.com/historical/default.asp?detect=1&symbol=SPX&close_date=12%2F22%2F00&x=0&y=0 [12/31/10]
8 - treasury.gov/resource-center/data-chart-center/interest-rates/Pages/TextView.aspx?data=realyield [12/31/10]
8 - treasury.gov/resource-center/data-chart-center/interest-rates/Pages/TextView.aspx?data=realyieldAll [12/31/10]
9 - treasurydirect.gov/instit/annceresult/press/preanre/2000/ofm11200.pdf [7/12/00]

This material was prepared by Peter Montoya Inc., and does not necessarily represent the views of the presenting party, nor their affiliates. This information should not be construed as investment, tax or legal advice. The Dow Jones Industrial Average is a price-weighted index of 30 actively traded blue-chip stocks. The NASDAQ Composite Index is an unmanaged, market-weighted index of all over-the-counter common stocks traded on the National Association of Securities Dealers Automated Quotation System. The Standard & Poor's 500 (S&P 500) is an unmanaged group of securities considered to be representative of the stock market in general. It is not possible to invest directly in an index. NYSE Group, Inc. (NYSE:NYX) operates two securities exchanges: the New York Stock Exchange (the “NYSE”) and NYSE Arca (formerly known as the Archipelago Exchange, or ArcaEx®, and the Pacific Exchange). NYSE Group is a leading provider of securities listing, trading and market data products and services. The New York Mercantile Exchange, Inc. (NYMEX) is the world's largest physical commodity futures exchange and the preeminent trading forum for energy and precious metals, with trading conducted through two divisions – the NYMEX Division, home to the energy, platinum, and palladium markets, and the COMEX Division, on which all other metals trade. Additional risks are associated with international investing, such as currency fluctuations, political and economic instability and differences in accounting standards. All information is believed to be from reliable sources; however we make no representation as to its completeness or accuracy. All economic and performance data is historical and not indicative of future results. Market indices discussed are unmanaged. Investors cannot invest in unmanaged indices. The publisher is not engaged in rendering legal, accounting or other professional services. If assistance is needed, the reader is advised to engage the services of a competent professional.

December 20, 2010 Weekly Market Commentary

OBAMA SIGNS TAX DEAL INTO LAW
President Obama signed the 2010 Tax Relief Act into law on December 17 after overwhelming passage in the House and Senate. The Bush-era tax cuts are thereby extended. Through 2012, the federal income tax tops out at 35% and taxes on dividends and capital gains top out at 15%. The 0% rate for long term gains realized in the 15% tax bracket is still in place and presents a tremendous tax planning opportunity, particularly for retirees that haven't yet started receiving Social Security and/or pension income.

Next year, the estate tax returns at 35% with a $5 million dollar exemption, effectively permitting couples to pass estates as large as $10 million to heirs; tax-free charitable IRA donations also come back in 2011. Employee payroll taxes will drop from 6.2% to 4.2% next year.1,2,3,4,5

A POSITIVE SIGNAL FOR THE FUTURE
The Conference Board’s leading economic indicators index (designed to be a gauge of economic momentum or lack thereof) jumped by 1.1% in November – the biggest gain in eight months. This follows a revised 0.4% advance in the index for October.6

PRODUCER PRICES OUTPACE CONSUMER PRICES
Consumer prices inched up 0.1% in November according to the Labor Department’s Consumer Price Index. The core CPI rose 0.1%. The Producer Price Index, on the other hand, rose by 0.8% last month. Consensus polls of economists at Briefing.com had projected a 0.2% rise in the CPI and a 0.5% gain in wholesale prices.7

HOUSING STARTS TURN NORTH
They improved for the first time in three months. The Commerce Department said November’s housing starts were up 3.9% from October levels. The 555,000 annual pace topped the 559,000 consensus projected in a Bloomberg News survey.8

STOCKS ADVANCE
It was a pretty quiet week on Wall Street, and major index performance across the five trading days was as follows: Dow, +0.72% to 11,491.91; S&P 500, +0.28% to 1,243.91; NASDAQ, +0.21% to 2,642.97. As of Friday, the DJIA had traded within a range of 100 points for six straight market days – that hadn’t occurred since January 2006. All three indices ended the week at +10% or better for 2010.9

COMING NEXT WEEK: No notable releases on Monday or Tuesday. Wednesday, we have the latest existing home sales figures and the final estimate of 3Q GDP. Thursday, we get data on consumer spending and durable goods orders for November, new home sales figures for November, the final University of Michigan consumer sentiment survey for December, and the latest initial and continuing claims numbers. That’s it for the week.


WEEKLY QUOTE
“It is not the years in your life but the life in your years that counts.”
– Adlai Stevenson

WEEKLY TIP
With the new year coming, one of your resolutions can be reviewing and/or rebalancing your portfolio, to see that your investments are in sync with your objectives.

Happy Holidays,

Kevin Kroskey

Bookmark and Share


Citations.

1 edition.cnn.com/2010/POLITICS/12/17/tax.deal/ [12/17/10]
2 – online.wsj.com/article/SB10001424052748703296604576005430598327972.html [12/7/10]
3 –tax.cchgroup.com/downloads/files/pdfs/legislation/bush-taxcuts.pdf [12/16/10]
4 – businessweek.com/ap/financialnews/D9K5IEN81.htm [12/17/10]
5 – npr.org/2010/12/10/131969824/some-worry-payroll-tax-cut-threatens-social-security [12/17/10]
6 - bloomberg.com/news/2010-12-17/u-s-leading-indicators-index-gains-most-in-eight-months-in-recovery-sign.html [12/17/10]
7 - thestreet.com/story/10947594/1/inflation-remains-subdued-in-november.html [12/15/10]
8 - bloomberg.com/news/2010-12-16/u-s-futures-fluctuate-starbucks-bank-of-america-climb-freeport-slides.html [12/16/10]
9 - cnbc.com/id/40722779 [12/17/10]
10 - bigcharts.marketwatch.com/historical/default.asp?detect=1&symbol=DJIA&close_date=12%2F17%2F09&x=0&y=0 [12/17/10]
10 - bigcharts.marketwatch.com/historical/default.asp?detect=1&symbol=COMP&close_date=12%2F17%2F09&x=0&y=0 [12/17/10]
10 - bigcharts.marketwatch.com/historical/default.asp?detect=1&symbol=SPX&close_date=12%2F17%2F09&x=0&y=0 [12/17/10]
10 - bigcharts.marketwatch.com/historical/default.asp?detect=1&symbol=DJIA&close_date=12%2F16%2F05&x=0&y=0 [12/17/10]
10 - bigcharts.marketwatch.com/historical/default.asp?detect=1&symbol=COMP&close_date=12%2F16%2F05&x=0&y=0 [12/17/10]
10 - bigcharts.marketwatch.com/historical/default.asp?detect=1&symbol=SPX&close_date=12%2F16%2F05&x=0&y=0 [12/17/10]
10 - bigcharts.marketwatch.com/historical/default.asp?detect=1&symbol=DJIA&close_date=12%2F18%2F00&x=0&y=0 [12/17/10]
10 - bigcharts.marketwatch.com/historical/default.asp?detect=1&symbol=COMP&close_date=12%2F18%2F00&x=0&y=0 [12/17/10]
10 - bigcharts.marketwatch.com/historical/default.asp?detect=1&symbol=SPX&close_date=12%2F18%2F00&x=0&y=0 [12/17/10]
11 - treasury.gov/resource-center/data-chart-center/interest-rates/Pages/TextView.aspx?data=realyield [12/17/10]
11 - ustreas.gov/offices/domestic-finance/debt-management/interest-rate/real_yield_historical.shtml [12/17/10]
12 - treasurydirect.gov/instit/annceresult/press/preanre/2000/ofm11200.pdf [7/12/00]
13 - montoyaregistry.com/Financial-Market.aspx?financial-market=8-retirement-tips&category=3 [12/18/10]

This material was prepared by Peter Montoya Inc., and does not necessarily represent the views of the presenting party, nor their affiliates. This information should not be construed as investment, tax or legal advice. The Dow Jones Industrial Average is a price-weighted index of 30 actively traded blue-chip stocks. The NASDAQ Composite Index is an unmanaged, market-weighted index of all over-the-counter common stocks traded on the National Association of Securities Dealers Automated Quotation System. The Standard & Poor's 500 (S&P 500) is an unmanaged group of securities considered to be representative of the stock market in general. It is not possible to invest directly in an index. NYSE Group, Inc. (NYSE:NYX) operates two securities exchanges: the New York Stock Exchange (the “NYSE”) and NYSE Arca (formerly known as the Archipelago Exchange, or ArcaEx®, and the Pacific Exchange). NYSE Group is a leading provider of securities listing, trading and market data products and services. The New York Mercantile Exchange, Inc. (NYMEX) is the world's largest physical commodity futures exchange and the preeminent trading forum for energy and precious metals, with trading conducted through two divisions – the NYMEX Division, home to the energy, platinum, and palladium markets, and the COMEX Division, on which all other metals trade. Additional risks are associated with international investing, such as currency fluctuations, political and economic instability and differences in accounting standards. All information is believed to be from reliable sources; however we make no representation as to its completeness or accuracy. All economic and performance data is historical and not indicative of future results. Market indices discussed are unmanaged. Investors cannot invest in unmanaged indices. The publisher is not engaged in rendering legal, accounting or other professional services. If assistance is needed, the reader is advised to engage the services of a competent professional.

December 6, 2010 Weekly Market Commentary

DECEMBER GETS OFF TO A BULLISH START

Recently, it's almost comical watching the market see-saw back and forth as emotionally-based investors swing with tides of varying economonic news. In the first three days of December, the S&P 500 gained 3.74% as Black Friday sales numbers and reassurance from the European Central Bank aided Wall Street. Gold closed at a record $1406.20 an ounce Friday. Then things swung the other way. Yet for the week, the big three U.S. indices performed as follows: DJIA, +2.62% to 11,382.09; S&P 500, +2.97% to 1,224.71; NASDAQ, +2.24% to 2,591.46 (its highest close in 35 months). (6,7)


JOBLESS RATE INCREASES BY 0.2%
Unemployment hit 9.8% last month. The latest Bureau of Labor Statistics report said the economy only created 39,000 new jobs in November; economists expected three times that. After all, ADP reported 93,000 new positions in the private sector last Wednesday, and the revised government estimate for October showed the economy adding 172,000 jobs in that month. Labor Department figures indicate that the unemployed and underemployed now make up around 17% of the population. (1,2)

SECOND POLL GAUGES CONFIDENCE AT 5-MONTH HIGH
The Conference Board’s consumer confidence index rose to 54.1 for November, reaching a peak unseen since June (which is exactly what happened last week with the University of Michigan’s consumer poll). Sub-indices measuring employment expectations and income expectations also improved. (3)

SOME GOOD NEWS FROM THE REAL ESTATE SECTOR
Pending home sales increased by 10.4% in October, according to the National Association of Realtors. This would seem to suggest better numbers for existing home sales in November. NAR’s pending home sales index is now back at the level it was before the appearance of the federal home buyer tax credit. (4)

ISM INDEXES BOTH AT 55 OR BETTER
The closely-watched manufacturing and non-manufacturing sector surveys from the Institute for Supply Management show moderate growth. The manufacturing index declined to 56.6 from October’s 56.9 mark; the service sector index improved from 54.3 in October to 55.0 in November. The manufacturing index showed a 7.7% slump in production for November; the service sector index showed 4.0% gains in export orders and inventories. (5)

COMING NEXT WEEK: It is a light week in terms of major economic releases. Wednesday, we get initial and continuing jobless claims data and learn about October wholesale inventories. Thursday, we have the University of Michigan’s first consumer sentiment survey for December.


WEEKLY QUOTE
“Nothing will ever be attempted, if all possible objections must be first overcome.”
– Samuel Johnson

WEEKLY TIP
Have you taken a Required Minimum Distribution from your IRA yet? If you are age 70½ or older, it’s time. If you are taking your very first RMD, you can put it off until April 1 of next year - but if you do that, you’ll have to take two RMDs in 2011. The RMD deadline for most IRA owners aged 70½ or older is December 31.

Best Regards,

Kevin Kroskey


Bookmark and Share


Citations.
1 - forbes.com/2010/12/03/markets-briefing-open-jobs-equities-unemployment.html [12/3/10]

2 - ocregister.com/articles/rate-278642-november-time.html [12/3/10]
3 - bloomberg.com/news/2010-11-30/stocks-in-u-s-pare-retreat-after-consumer-confidence-report-tops-estimate.html [11/30/10]
4 - online.wsj.com/article/SB10001424052748703377504575650470810345484.html [12/3/10]
5 - ism.ws/ISMReport/nonmfgROB.cfm [12/3/10]
6 - cnbc.com/id/40496761 [12/3/10]
7 - money.cnn.com/2010/12/03/markets/markets_newyork/index.htm [12/3/10]
8 - bigcharts.marketwatch.com/historical/default.asp?detect=1&symbol=DJIA&close_date=12%2F3%2F09&x=0&y=0 [12/3/10]
8 - bigcharts.marketwatch.com/historical/default.asp?detect=1&symbol=COMP&close_date=12%2F3%2F09&x=0&y=0 [12/3/10]
8 - bigcharts.marketwatch.com/historical/default.asp?detect=1&symbol=SPX&close_date=12%2F3%2F09&x=0&y=0 [12/3/10]
8 - bigcharts.marketwatch.com/historical/default.asp?detect=1&symbol=DJIA&close_date=12%2F2%2F05&x=0&y=0 [12/3/10]
8 - bigcharts.marketwatch.com/historical/default.asp?detect=1&symbol=COMP&close_date=12%2F2%2F05&x=0&y=0 [12/3/10]
8 - bigcharts.marketwatch.com/historical/default.asp?detect=1&symbol=SPX&close_date=12%2F2%2F05&x=0&y=0 [12/3/10]
8 - bigcharts.marketwatch.com/historical/default.asp?detect=1&symbol=DJIA&close_date=12%2F4%2F00&x=0&y=0 [12/3/10]
8 - bigcharts.marketwatch.com/historical/default.asp?detect=1&symbol=COMP&close_date=12%2F4%2F00&x=0&y=0 [12/3/10]
8 - bigcharts.marketwatch.com/historical/default.asp?detect=1&symbol=SPX&close_date=12%2F4%2F00&x=0&y=0 [12/3/10]
9 - ustreas.gov/offices/domestic-finance/debt-management/interest-rate/real_yield.shtml [12/3/10]
9 - ustreas.gov/offices/domestic-finance/debt-management/interest-rate/real_yield_historical.shtml [12/3/10]
10 - treasurydirect.gov/instit/annceresult/press/preanre/2000/ofm11200.pdf [7/12/00]


This material was prepared by Peter Montoya Inc., and does not necessarily represent the views of the presenting party, nor their affiliates. This information should not be construed as investment, tax or legal advice. The Dow Jones Industrial Average is a price-weighted index of 30 actively traded blue-chip stocks. The NASDAQ Composite Index is an unmanaged, market-weighted index of all over-the-counter common stocks traded on the National Association of Securities Dealers Automated Quotation System. The Standard & Poor's 500 (S&P 500) is an unmanaged group of securities considered to be representative of the stock market in general. It is not possible to invest directly in an index. NYSE Group, Inc. (NYSE:NYX) operates two securities exchanges: the New York Stock Exchange (the “NYSE”) and NYSE Arca (formerly known as the Archipelago Exchange, or ArcaEx®, and the Pacific Exchange). NYSE Group is a leading provider of securities listing, trading and market data products and services. The New York Mercantile Exchange, Inc. (NYMEX) is the world's largest physical commodity futures exchange and the preeminent trading forum for energy and precious metals, with trading conducted through two divisions – the NYMEX Division, home to the energy, platinum, and palladium markets, and the COMEX Division, on which all other metals trade. Additional risks are associated with international investing, such as currency fluctuations, political and economic instability and differences in accounting standards. All information is believed to be from reliable sources; however we make no representation as to its completeness or accuracy. All economic and performance data is historical and not indicative of future results. Market indices discussed are unmanaged. Investors cannot invest in unmanaged indices. The publisher is not engaged in rendering legal, accounting or other professional services. If assistance is needed, the reader is advised to engage the services of a competent professional.


November 22, 2010 Weekly Market Commentary

NO RISE IN CORE CPI OR CORE PPI IN OCTOBER
Last month, the Consumer Price Index rose 0.2% with core CPI flat for the third month in a row. Core CPI has advanced at a crawl in the past 12 months: just 0.6% compared to a Federal Reserve annualized target of 2.0%. Producer prices rose 0.4% last month, duplicating their August and September increase. Yet core producer prices fell 0.6%.1,2

HOUSING STARTS SLIP, MORTGAGE RATES JUMP
The Commerce Department announced an 11.7% slump in new residential construction starts for the month of October, and a 1.9% slip from year-ago levels. A drop in apartment and condo construction accounted for most of the October decline. Last week, Freddie Mac said that the average rate on a 30-year conventional home loan had jumped to 4.39% from 4.17% a week prior. The average rate for a 15-year FRM had increased to 3.76%, up from 3.57% in Freddie’s previous survey.3,4

RETAIL SALES 7.3% BETTER THAN A YEAR AGO
Car buying drove a 1.2% gain in U.S. retail sales in October. In fact, the Census Bureau reported a 14.7% year-over-year increase in sales volume at car dealerships. The year-over-year gain in overall retail sales was 7.3%, and 13.5% for non-store retailers.5

CONFERENCE BOARD INDEX UP 0.5%
The Conference Board’s index of leading economic indicators notched its second straight half-percent increase in October. This was also its fourth straight advance.6

GM IPO TURNS THE WEEK AROUND
Thursday’s eagerly awaited initial public offering from General Motors sent the Dow on a triple-digit rally and turned a down week into a flat one. Here is how the three marquee indices performed last week: DJIA, +0.10% to 11,203.55; S&P 500, +0.04% to 1,199.73; NASDAQ, 0.00% to 2,518.12 (it actually fell .09 on the week).7,8

COMING NEXT WEEK: No economic releases are scheduled for Monday. Tuesday, we have October existing home sales and the release of the minutes from the Fed’s November 3 policy meeting, plus the second estimate of 3Q GDP. Wednesday, we have even more data: the October consumer spending report, October new home sales, October durable goods orders and the final November consumer sentiment survey from the University of Michigan.

 
WEEKLY QUOTE
“You are the only real obstacle in your path to a fulfilling life.”
– Les Brown

WEEKLY TIP
Ramp up your college savings with rewards programs. There are credit cards and online shopping programs that can allow you to direct a steady stream of rebates toward your education fund.


Best Regards,

Kevin Kroskey


Bookmark and Share


Citations.
1 - marketwatch.com/story/us-consumer-prices-up-02-in-october-2010-11-17 [11/17/10]
2 - blogs.barrons.com/stockstowatchtoday/2010/11/16/producer-prices-lower-than-expected-but-crude-prices-jump/ [11/16/10]
3 - articles.latimes.com/print/2010/nov/18/business/la-fi-housing-mortgage-20101118 [11/18/10]
4 - freddiemac.com/pmms/release.html [11/18/10]
5 - census.gov/retail/marts/www/marts_current.pdf [11/15/10]
6 -boston.com/news/nation/washington/articles/2010/11/19/new_figures_indicate_economy_is _picking_up [11/19/10]
7 - cnbc.com/id/40279101 [11/19/10]
8 - cnbc.com/id/40155548 [11/12/10]
9 - bigcharts.marketwatch.com/historical/default.asp?detect=1&symbol=DJIA&close_date=11%2F19%2F09&x=0&y=0 [11/19/10]
9 - bigcharts.marketwatch.com/historical/default.asp?detect=1&symbol=COMP&close_date=11%2F19%2F09&x=0&y=0 [11/19/10]
9 - bigcharts.marketwatch.com/historical/default.asp?detect=1&symbol=SPX&close_date=11%2F19%2F09&x=0&y=0 [11/19/10]
9 - bigcharts.marketwatch.com/historical/default.asp?detect=1&symbol=DJIA&close_date=11%2F18%2F05&x=0&y=0 [11/19/10]
9 - bigcharts.marketwatch.com/historical/default.asp?detect=1&symbol=COMP&close_date=11%2F18%2F05&x=0&y=0 [11/19/10]
9 - bigcharts.marketwatch.com/historical/default.asp?detect=1&symbol=SPX&close_date=11%2F18%2F05&x=0&y=0 [11/19/10]
9 - bigcharts.marketwatch.com/historical/default.asp?detect=1&symbol=DJIA&close_date=11%2F20%2F00&x=0&y=0 [11/19/10]
9 - bigcharts.marketwatch.com/historical/default.asp?detect=1&symbol=COMP&close_date=11%2F20%2F00&x=0&y=0 [11/19/10]
9 - bigcharts.marketwatch.com/historical/default.asp?detect=1&symbol=SPX&close_date=11%2F20%2F00&x=0&y=0 [11/19/10]
10 - ustreas.gov/offices/domestic-finance/debt-management/interest-rate/real_yield.shtml [11/19/10]
10 - ustreas.gov/offices/domestic-finance/debt-management/interest-rate/real_yield_historical.shtml [11/19/10]
11 - treasurydirect.gov/instit/annceresult/press/preanre/2000/ofm11200.pdf [7/12/00]

This material was prepared by Peter Montoya Inc., and does not necessarily represent the views of the presenting party, nor their affiliates. This information should not be construed as investment, tax or legal advice. The Dow Jones Industrial Average is a price-weighted index of 30 actively traded blue-chip stocks. The NASDAQ Composite Index is an unmanaged, market-weighted index of all over-the-counter common stocks traded on the National Association of Securities Dealers Automated Quotation System. The Standard & Poor's 500 (S&P 500) is an unmanaged group of securities considered to be representative of the stock market in general. It is not possible to invest directly in an index. NYSE Group, Inc. (NYSE:NYX) operates two securities exchanges: the New York Stock Exchange (the “NYSE”) and NYSE Arca (formerly known as the Archipelago Exchange, or ArcaEx®, and the Pacific Exchange). NYSE Group is a leading provider of securities listing, trading and market data products and services. The New York Mercantile Exchange, Inc. (NYMEX) is the world's largest physical commodity futures exchange and the preeminent trading forum for energy and precious metals, with trading conducted through two divisions – the NYMEX Division, home to the energy, platinum, and palladium markets, and the COMEX Division, on which all other metals trade. Additional risks are associated with international investing, such as currency fluctuations, political and economic instability and differences in accounting standards. All information is believed to be from reliable sources; however we make no representation as to its completeness or accuracy. All economic and performance data is historical and not indicative of future results. Market indices discussed are unmanaged. Investors cannot invest in unmanaged indices. The publisher is not engaged in rendering legal, accounting or other professional services. If assistance is needed, the reader is advised to engage the services of a competent professional.

Future Posts at www.TrueWealthDesign.com

Any future blog posts will be done at www.TrueWealthDesign.com . Thank you, Kevin Kroskey, CFP, MBA