August was a good month for stocks. The S&P 500 surpassed 2,000 while logging a 3.77% monthly advance. Even with ISIS controlling parts of Iraq and Syria and Russia possibly conducting a stealth invasion of Ukraine, Wall Street retained its optimism. The rally in stocks wasn’t matched by gains for oil and gold and the housing market was cooler than it was last summer. Most U.S. indicators signaled a healthier economy, perhaps one strong enough to motivate the Federal Reserve to raise interest rates a bit sooner than forecast.
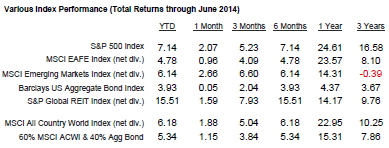
Key index performance is shown in the table below.
Key index performance is shown in the table below.

DOMESTIC ECONOMIC HEALTH
Commerce Department data showed consumer spending unexpectedly ticking down 0.1% in July, even with personal wages rising 0.2% - and seasonally adjusted retail sales were also flat. If households were retaining more of their incomes than expected, they were also more confident in August than they had been the previous month. The Conference Board’s August consumer confidence index hit 92.4 (blowing past the Briefing.com forecast of a descent to 88.0) and the University of Michigan’s consumer sentiment index ended August with a climb to 82.5.2,3
The latest Consumer Price Index showed inflation running right at the Fed’s target: an annual increase of 2.0%, with a July gain of 0.1%. (The core CPI was up 1.9% in a year and 0.1% in July.) Wholesale prices also rose 0.1% in July, putting the year-over-year increase at just 1.7%.4,5
American manufacturing was clearly very healthy this summer. The Federal Reserve announced a 1.0% July increase in factory production (the best month for the indicator since February) with an impressive 10.1% July jump in car manufacturing (a 5-year peak). Thanks to a huge request for new planes at Boeing, overall hard goods orders improved 22.6% in July.5,6
Indeed, the Institute for Supply Management’s August factory PMI affirmed the Fed’s findings: it reached 59.0, the best reading since March 2011. Weeks prior, ISM’s service sector PMI had come in at 56.0, up 1.6 points from June.7,8
Perhaps the best news of all was the pace of hiring. In July, U.S. employers added more than 200,000 jobs for a sixth straight month. That hadn’t happened in 17 years. Another good thing about July’s 209,000 new hires: according to Labor Department data, 47,000 entered business and professional positions.9
Finally, second quarter growth was judged even better than previously thought. Toward the end of August, the Commerce Department revised Q2 GDP from 4.0% to 4.2%. Capital spending was up 8.4% during the quarter.10
GLOBAL ECONOMIC HEALTH
Had Russia invaded Ukraine under the pretense of offering humanitarian aid? If so, the economic reaction to that incursion was still relatively localized. At the end of the month, NATO reported it had footage of Russian combat units operating within Ukraine’s borders – and still, U.S. stocks seemed unaffected. Sanctions imposed on Russia did perhaps affect the eurozone Markit PMI, which ticked down to 50.7 in August.11,12
China’s HSBC factory PMI flirted with contraction at 50.2 – not exactly encouraging news from the globe’s top market for commodities. The PRC’s official PMI was at 51.1 last month, underneath July's 51.7 mark. Japan’s PMI increased 1.7 points last month to 52.2.12
Markets also took the threats posed by ISIS in stride in August. Fears of oil output being presently disrupted in Iraq were muted. Even though the largest exporter of energy supplies outside the Middle East – Russia – was in a conflict of its own, there was no leap in energy prices. In part, that can be attributed to record output from the U.S. and reduced demand given the eurozone’s lingering recession and China’s economic engines revving down slightly this year.13
WORLD MARKETS
In terms of indices, some of the best August performances occurred in the Americas. Brazil’s Bovespa jumped 9.78% and Argentina’s MERVAL soared 19.90%. Mexico’s IPC All-Share rose 4.13% while Canada’s S&P/TSX Composite gained a mere 1.92%. The major European national bourses also recorded advances – 0.67% for the DAX, 3.18% for the CAC 40, 1.33% for the FTSE 100. In the Asia Pacific region, benchmarks were up and down in August – losses of 1.26% for the Nikkei 225 and 0.37% for the Kospi, gains of 2.87% for the Sensex, 2.71% for the PSE and 0.71% for the Shanghai Composite. Vietnam’s VN-Index notably advanced 6.81% last month. The Hang Seng and S&P/ASX 200 respectively posted tiny August losses (0.06% for the former, 0.12% for the latter).1
COMMODITIES MARKETS
Last month, cotton went +8.87% to register the biggest gain among major commodities. Soybeans went -10.93% to rack up the largest August loss. As for the rest of the ag futures, the month played out like this: wheat, +3.40%; corn, +0.98%; cocoa, + 1.25%; coffee, -0.89%; sugar, -5.89%.15
As for metals, gold managed a 0.31% August gain, yet silver lost 5.76%, platinum 2.85% and copper 2.76%. Gold ended the market month at $1,287.40 on the COMEX, silver finishing at $19.49. Turning to the buck, the U.S. Dollar Index gained 1.58% to settle at 82.75 on August 29. Oil slid 1.85% for August; at the close on August 29, NYMEX crude was worth $95.96 per barrel. Heating oil retreated 0.95% last month while unleaded gasoline lost 1.40%; natural gas futures certainly looked good, rising 6.69%.15,16
REAL ESTATE
Annual home price gains were clearly leveling off, with the 20-city Case-Shiller home price index showing an 8.1% yearly gain in its June edition compared to 9.4% a month earlier. The National Association of Realtors announced a 2.4% rise in residential resales for July plus a 3.3% increase in pending home sales. New home buying was down 2.4% for the month, according to the Census Bureau.2,8
July brought a lot of groundbreaking. According to Census Bureau data, housing starts increased 15.7% for the month, and there was also an 8.1% rise for building permits.8
Conventional home loans got a touch cheaper during August, with Freddie Mac calculating the average interest rate on the 30-year FRM at 4.10% in its August 28 Primary Mortgage Market Survey. That compared to 4.12% on July 31. Interest rates for 5/1-year ARMs also declined from 3.01% to 2.97% in that period. Average interest rates on the 15-year FRM (3.23% to 3.25%) and 1-year ARM (2.38% to 2.39%) increased in that stretch.17
LOOKING BACK…LOOKING FORWARD
Though the headlines carried news of some fairly significant geopolitical crises in August, Wall Street wasn’t all that anxious about them. One telling sign is the S&P rising to an all-time record; another is the CBOE VIX, the so-called “fear index,” closing down at 11.98 on August 29 (the final market day of the month).1
While the VIX sank 29.32% in August, the key U.S. stock indices all gained 3% or more. The Nasdaq rose 4.82%, the Russell 2000 4.85%, and the Dow 3.23%. At the close on August 29, the S&P settled at 2,003.37, the DJIA at 17,098.45, the NASDAQ at 4,580.27 and the RUT at 1,174.35.1
UPCOMING ECONOMIC RELEASES: The rest of September presents the following reports and announcements: ISM’s August services PMI, the August ADP employment report and the August Challenger job cuts report (9/4), the Labor Department’s August jobs report (9/5), July wholesale inventories (9/10), July business inventories, August retail sales and the University of Michigan’s initial September consumer sentiment index (9/12), August industrial production (9/15), the August PPI (9/16), the latest Federal Reserve policy statement and the August CPI (9/17), August housing starts and building permits (9/18), the Conference Board’s August leading indicator index (9/19), August existing home sales (9/22), August new home sales (9/24), August durable goods orders (9/25), the final estimate of Q2 GDP and the final September consumer sentiment index from the University of Michigan (9/26), August pending home sales and personal spending (9/29), and finally the July Case-Shiller home price index and the Conference Board’s September consumer confidence index (9/30).
To Your Prosperity,
Kevin Kroskey, CFP®, MBA
This article adapted with permission from MarketingLibrary.net.
Citations.
1 - online.wsj.com/mdc/public/page/2_3023-monthly_gblstkidx.html [8/29/14]
2 - biz.yahoo.com/c/ec/201435.html [9/2/14]
3 - foxbusiness.com/economy-policy/2014/08/13/us-retail-sales-basically-flat-in-july-recent-job-growth-fails-to-boost/ [8/13/14]
4 - reuters.com/article/2014/08/19/us-usa-economy-inflation-idUSKBN0GJ15U20140819 [8/19/14]
5 - reuters.com/article/2014/08/15/us-usa-economy-prices-idUSKBN0GF11G20140815 [8/15/14]
6 - marketwatch.com/story/durable-goods-orders-jump-226-in-july-on-boeing-contracts-2014-08-26 [8/26/14]
7 - ism.ws/ismreport/mfgrob.cfm [9/2/14]
8 - investing.com/economic-calendar/ [9/2/14]
9 - marketwatch.com/story/us-adds-209000-jobs-in-july-to-keep-hot-streak-intact-2014-08-01 [8/1/14]
10 - abcnews.go.com/Business/wireStory/revised-estimate-q2-growth-stay-solid-25155529 [8/28/14]
11 - tinyurl.com/omb5ll2 [7/1/14]
12 - fxstreet.com/analysis/za-today/2014/09/02/ [9/2/14]
13 - investing.com/analysis/the-world%E2%80%99s-on-fire:-5-risks-to-watch-224521 [9/2/14]
14 - mscibarra.com/products/indices/international_equity_indices/gimi/stdindex/performance.html [8/29/14]
15 - money.cnn.com/data/commodities/ [9/1/14]
16 - online.wsj.com/mdc/public/npage/2_3050.html?mod=mdc_curr_dtabnk&symb=DXY [9/1/14]
17 - freddiemac.com/pmms/archive.html [9/2/14]
18 - bigcharts.marketwatch.com/historical/default.asp?symb=DJIA&closeDate=8%2F29%2F13&x=0&y=0 [8/29/14]
18 - bigcharts.marketwatch.com/historical/default.asp?symb=COMP&closeDate=8%2F29%2F13&x=0&y=0 [8/29/14]
18 - bigcharts.marketwatch.com/historical/default.asp?symb=SPX&closeDate=8%2F29%2F13&x=0&y=0 [8/29/14]
18 - bigcharts.marketwatch.com/historical/default.asp?symb=DJIA&closeDate=8%2F28%2F09&x=0&y=0 [8/29/14]
18 - bigcharts.marketwatch.com/historical/default.asp?symb=COMP&closeDate=8%2F28%2F09&x=0&y=0 [8/29/14]
18 - bigcharts.marketwatch.com/historical/default.asp?symb=SPX&closeDate=8%2F28%2F09&x=0&y=0 [8/29/14]
18 - bigcharts.marketwatch.com/historical/default.asp?symb=DJIA&closeDate=8%2F30%2F04&x=0&y=0 [8/29/14]
18 - bigcharts.marketwatch.com/historical/default.asp?symb=COMP&closeDate=8%2F30%2F04&x=0&y=0 [8/29/14]
18 - bigcharts.marketwatch.com/historical/default.asp?symb=SPX&closeDate=8%2F30%2F04&x=0&y=0 [8/29/14]
19 - treasury.gov/resource-center/data-chart-center/interest-rates/Pages/TextView.aspx?data=realyieldAll [9/2/14]
20 - marketwatch.com/story/heres-what-history-says-about-the-stock-market-in-september-2014-08-29 [8/29/14]