THE MONTH IN BRIEF
November brought a dizzying plunge in oil prices, confirmation of a recession in Japan and distinct hints of one in the euro area, and declines in the pace of manufacturing activity in America, Europe and China. Even so, the month was remarkably placid on Wall Street – unlike October, we didn’t see a lot of days marked by triple-digit Dow swings. The Dow, in fact, rose 2.52% on the month; many overseas benchmarks posted nice gains as well. Losses plagued the commodities sector. The latest GDP estimates out of Washington suggested our economy was in better shape than some analysts thought.1
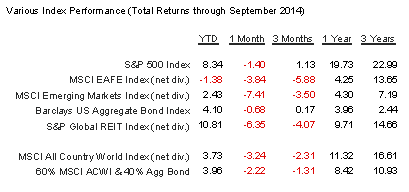
Key index performance is shown in the table below.

November brought a dizzying plunge in oil prices, confirmation of a recession in Japan and distinct hints of one in the euro area, and declines in the pace of manufacturing activity in America, Europe and China. Even so, the month was remarkably placid on Wall Street – unlike October, we didn’t see a lot of days marked by triple-digit Dow swings. The Dow, in fact, rose 2.52% on the month; many overseas benchmarks posted nice gains as well. Losses plagued the commodities sector. The latest GDP estimates out of Washington suggested our economy was in better shape than some analysts thought.1
Key index performance is shown in the table below.
DOMESTIC ECONOMIC HEALTH
By the estimate of the federal government, the second and third quarter of 2014 amounted to the best six months for the U.S. economy since 2003. The Commerce Department revised Q3 output up to 3.9%, complementing 4.6% growth for Q2.2
Another key economic indicator improved further. The jobless rate had ticked down to 5.8% in October, with the U-6 rate (encompassing part-time workers, jobseekers and those out of the job hunt) falling 0.3% to 11.5%. Labor Department data showed companies adding 214,000 new hires to their payrolls in that month.3,4
While economists certainly found this encouraging, households weren’t feeling so upbeat. The Conference Board’s consumer confidence index fell to 88.7 from its October reading of 94.5; the University of Michigan’s consumer sentiment index did better, finishing November 1.9 points higher at 88.8.5
The Consumer Price Index was flat in October, and up just 1.7% year-over-year. Still, the tenth month of the year brought only modest gains for consumer spending (0.2%) and retail sales (0.3%). Total Black Friday sales were down 11% from 2013 levels, according to National Retail Federation estimates; this could have reflected online sales growth and more stores having deep discounts on Thanksgiving Day.5,6
Declining gas prices across the month effectively put more money in consumers’ pockets, a factor that may lead to greater personal spending for November. By December 1, AAA’s Daily Fuel Gauge Report showed regular unleaded averaging just $2.77 a gallon.7
U.S. manufacturing activity cooled a bit in November, but our factory sector was still hotter than many others worldwide. The Institute for Supply Management’s November manufacturing PMI came in with a reading of 58.7, down from 59.0 in October. (ISM’s service sector PMI had slipped 1.5 points to 57.1 in October.) Overall durable goods orders rose 0.4% in October, but core durable orders fell 0.9%. The headline Producer Price Index was up 0.2% for October, but only 1.5% annually.5,8,9
GLOBAL ECONOMIC HEALTH
Unexpectedly, Japan fell into a recession in Q3. Analysts surveyed by Reuters thought its economy would expand 2.1%; instead, there was a 1.6% contraction following a 7.3% reversal in Q2. This affirmed and underscored the Bank of Japan’s decision to ease for the foreseeable future.10
The euro area hadn’t slipped back into recession yet, but it was coming perilously close in the eyes of many economists. Its yearly inflation measured just 0.3% last month and its jobless rate was at 11.5%. European Central Bank President Mario Draghi said that ECB leaders would consider exceptional moves (such as buying sovereign debt) to ward off deflation. The Markit manufacturing PMI for the eurozone barely showed expansion for November with a 50.1 mark.10,11,12
Word came that China’s economy had grown 7.3% in Q3, putting it on pace for its worst year since 1990. China’s official factory PMI came in a half-point lower in November at 50.3, and the HSBC/Markit PMI for the PRC showed no expansion for the sector at all with a reading of 50.0 that represented a 6-month low. Markit manufacturing PMIs in Indonesia and Japan also fell, but India’s rose to a 21-month high in November.12,13
WORLD MARKETS
Generally speaking, November was a good month with many consequential indices advancing. Some of the gains in the Asia Pacific region: Sensex, 2.97%; KOSPI, 0.83%; Shanghai Composite, 10.85%; Nikkei 225, 6.37%; KSE 100, 2.70%. The Hang Seng was flat (-0.04% to be precise) while Australia's ASX 200 suffered a 3.86% retreat. Elsewhere in the Americas, the Bovespa had a flat month (+0.07%) while the TSX Composite rose 0.90% and the IPC All-Share lost 1.86%.1
Major European indices saw the following November gains: CAC 40, 3.71%; DAX, 7.01%; IBEX, 2.80%; FTSE MIB, 1.17%; FTSE 100, 2.69%. Russia's RTS was the big November loser, retreating 10.74%.1
As for multinational and regional benchmarks, the Global Dow rose 1.72% in November, the Europe Dow 2.71% and the Dow Jones Americas 1.91%; the Asia Dow lost 0.53%. Europe’s STOXX 600 bourse advanced 3.10% for the month. The MSCI World Index gained 1.84%, but MSCI’s Emerging Markets Index lost 1.12%.1,14
COMMODITIES MARKETS
On November 28, OPEC ministers made no move to reduce oil output from their respective nations. That cemented an awful monthly loss for NYMEX crude – prices fell 18.23% for November to a settlement of $66.15 a barrel. Heating oil (-12.60%) and RBOB gasoline (-12.54%) were also crushed last month. The same couldn’t be said for natural gas; it rose 5.72% in November. Cold weather was not only a boon to natgas futures, but also an aid to wheat futures: they rose 8.74% for November, standing out in a field of losses among crops. Corn did advance 0.27%, but coffee dipped 0.90%, cocoa 0.69%, cotton 5.16%, sugar 2.87% and soybeans 2.59%.15
Gold didn’t fare too badly in November, losing only 0.54% and settling at a COMEX price of $1.175.20 an ounce at month’s end. Copper fell 6.43% on the month, platinum 1.35% and silver 3.24% (it wrapped up the month at $15.49 an ounce). The U.S. Dollar Index tacked on another 1.43% to its YTD gain and ended November at 88.16.15,16
REAL ESTATE
The month’s last Freddie Mac Primary Mortgage Market survey (November 26) found the average interest rate for a 30-year FRM at 3.97%, down 0.01% from the October 30 survey. Rates on other types of home loans moved appreciably during the month. On November 26, the mean rates for the 15-year FRM, 5/1-year ARM and 1-year ARM were respectively at 3.17%, 3.01% and 2.44%; compare that with 3.13%, 2.94% and 2.43% on October 30.17
Home sales (new and existing) again improved to minor degree. The National Association of Realtors found resales up 1.5% in October – but most importantly, October brought the first year-over-year gain in sales (2.5%) seen in 12 months. Across a year of data, distressed sales had fallen to 9% of the market from 14%. (Not all the news from NAR was good; its pending home sales index fell 1.1% for October.) New home purchases increased in October as well – the Census Bureau measured a 0.7% gain, marking a third straight month of increasing sales volume.5,18
NAR stated that the median existing-home price was $208,300 in October, down from $209,700 in September. September’s S&P/Case-Shiller Home Price Index showed only a 4.9% annualized gain (this was across the full 20-city index).5,18
As for new projects, the Census Bureau also noted a 4.8% gain in building permits in November, with the indicator reaching a 6-year peak. A drop in multi-family projects sent overall housing starts down 2.8% in October, though single-family starts rose 4.2%.19
LOOKING BACK…LOOKING FORWARD
While the Russell 2000 had a flat month (actually losing 0.02% to 1,173.23), other major U.S. indices fared well in November, with the S&P 500 rising 2.45% to 2,067.56, the NASDAQ gaining 3.47% to 4,791.63 and the DJIA advancing 2.52% to 17,828.24. The CBOE VIX ended November at 13.33, sliding 4.99% for the month.1
The fall earnings season, the waning fears about Ebola invading the U.S. and the ease with which Wall Street accepted the end of QE3 were factors in a very positive November. Will stocks continue to rally in December as energy investors wait for a point of capitulation? One view says cheap oil is good for the consumer, the broad economy and the stock market. Another view sees an extended lack of demand not only hurting energy shares, but also breeding unemployment and deflation. Eyes will also be on the Fed – as we are on the cusp of 2015, its December policy meeting might be a moment at which some clues emerge about the timing of an interest rate hike. Still, stocks don’t seem too beset by obstacles as we head toward the New Year, and with any luck, the December 31 close for the S&P 500 just might be a record one.
UPCOMING ECONOMIC RELEASES: Here is a roll call of the important stateside reports and releases in the year’s final month: November’s ISM services PMI, a new Federal Reserve Beige Book and the November ADP employment report (12/3), November’s Challenger job-cut report (12/4), the November jobs report from the Labor Department and October factory orders (12/5), October wholesale inventories (12/9), November retail sales and October business inventories (12/11), the preliminary December consumer sentiment index from the University of Michigan plus the November PPI (12/11), November industrial production (12/15), November housing starts and building permits (12/16), a Fed policy statement and November’s CPI (12/17), the Conference Board’s leading indicator index for November (12/18), November existing home sales (12/22), the final estimate of Q3 GDP, the final December consumer sentiment index from the University of Michigan, and November new home sales, personal spending and hard goods orders (12/23), October’s Case-Shiller home price index and 2014’s last Conference Board consumer confidence index (12/30), and then finally NAR’s report on November pending home sales (12/31).
To Your Prosperity,
Kevin Kroskey, CFP®, MBA
This article adapted with permission from MarketingLibrary.net.
Citations.
1 - online.wsj.com/mdc/public/page/2_3023-monthly_gblstkidx.html [11/30/14]2 - nasdaq.com/article/us-thirdquarter-gdp-revised-up-to-39-advance-20141125-00467 [11/25/14]
3 - ncsl.org/research/labor-and-employment/national-employment-monthly-update.aspx [11/7/14]
4 - portalseven.com/employment/unemployment_rate_u6.jsp [11/26/14]
5 - investing.com/economic-calendar/ [11/26/14]
6 - tinyurl.com/p9lj9f4 [12/1/14]
7 - fuelgaugereport.aaa.com [12/1/14]
8 - ism.ws/ismreport/NonMfgROB.cfm [12/1/14]
9 - ism.ws/ismreport/NonMfgROB.cfm [11/5/14]
10 - tinyurl.com/pxyju2p [11/17/14]
11 - epp.eurostat.ec.europa.eu/portal/page/portal/eurostat/home/ [12/1/14]
12 - reuters.com/article/2014/12/01/us-global-economy-idUSKCN0JF1AN20141201 [12/1/14]
13 - reuters.com/article/2014/11/20/us-global-economy-idUSKCN0J407V20141120 [11/20/14]
14 - mscibarra.com/products/indices/international_equity_indices/gimi/stdindex/performance.html [11/30/14]
15 - money.cnn.com/data/commodities/ [11/30/14]16 - online.wsj.com/mdc/public/npage/2_3050.html?mod=mdc_curr_dtabnk&symb=DXY [11/30/14]
17 - freddiemac.com/pmms/archive.html [12/1/14]
18 - forbes.com/sites/erincarlyle/2014/11/20/existing-home-sales-rise-1-5-in-october-hit-fastest-pace-in-more-than-year-says-nar/ [11/20/14]
19 - bloomberg.com/news/2014-11-19/housing-starts-in-u-s-fall-on-multifamily-as-permits-climb.html [11/19/14]
20 - bigcharts.marketwatch.com/historical/default.asp?symb=DJIA&closeDate=11%2F29%2F13&x=0&y=0 [11/28/14]
20 - bigcharts.marketwatch.com/historical/default.asp?symb=COMP&closeDate=11%2F29%2F13&x=0&y=0 [11/28/14]
20 - bigcharts.marketwatch.com/historical/default.asp?symb=SPX&closeDate=11%2F29%2F13&x=0&y=0 [11/28/14]
20 - bigcharts.marketwatch.com/historical/default.asp?symb=DJIA&closeDate=11%2F27%2F09&x=0&y=0 [11/28/14]
20 - bigcharts.marketwatch.com/historical/default.asp?symb=COMP&closeDate=11%2F27%2F09&x=0&y=0 [11/28/14]
20 - bigcharts.marketwatch.com/historical/default.asp?symb=SPX&closeDate=11%2F27%2F09&x=0&y=0 [11/28/14]
20 - bigcharts.marketwatch.com/historical/default.asp?symb=DJIA&closeDate=11%2F29%2F04&x=0&y=0 [11/28/14]
20 - bigcharts.marketwatch.com/historical/default.asp?symb=COMP&closeDate=11%2F29%2F04&x=0&y=0 [11/28/14]
20 - bigcharts.marketwatch.com/historical/default.asp?symb=SPX&closeDate=11%2F29%2F04&x=0&y=0 [11/28/14]
21 - treasury.gov/resource-center/data-chart-center/interest-rates/Pages/TextView.aspx?data=realyieldAll [11/3/14]