Individual investors are having a hard time deciding if they want to be bullish or bearish on the stock market.
The American Association of Individual Investors is a non-profit association of 150,000 investors. Each week, the association compiles a sentiment survey of its members which measures the percentage of individual investors who are bullish, bearish, or neutral on the stock market for the next six months. Lately, their sentiment numbers have been all over the place.
For the week ending September 15, 2010, the bullish sentiment increased to 50.9%, which was the second highest reading in two years, according to Bespoke Investment Group. That was also well above the long-term average bullish reading of 39.0%. However, just three weeks earlier, the bullish sentiment was only 20.7%, which was its second lowest reading in the past two years.
So, what changed in the past three weeks? The simple answer is a very nice stock market rally. Between August 26 and September 16 -- the three weeks between the two surveys -- the S&P 500 index rose 7.4%, according to data from Yahoo! That rally helped turn many of the bears in the survey to bulls.
While this weekly sentiment survey is widely reported in the media, it is basically of little value unless it is at an extreme level of bullishness or bearishness. According to MarketGauge.com, bullish readings above 70.0%, “have been timely predictors of corrections in an up trend,” while bullish readings below 30.0% in a weak market, “indicate a level of fear and capitulation by individual investors which is common at market lows.” Even this 'timely predictor' descriptor needs to often be taken with a grain of salt.
Extreme sentiment readings may actually be a contrarian indicator of where the market is heading. The takeaway is, when individual investors get extremely bullish or bearish, it may be best to do just the opposite!
SUCCESSFUL INVESTING IS NOT LIKE DRAWING A STRAIGHT LINE from point A to point B. Rather, it’s more like being able to connect the zig-zag dots along the way.
Steve Jobs, the co-founder of Apple Computer, spoke to the graduating students at Stanford University in 2005 and told a story about how on a whim, he dropped in on a calligraphy class while he was attending Reed College back in the early 1970s. At the time, he found the class utterly fascinating, but totally useless. It wasn’t until 10 years later, when he was designing the Macintosh computer, that he was able to connect the dots. He decided to take what he learned about calligraphy and incorporate it into the computer. The result was the Macintosh, which became the first computer with beautiful typography. It became a huge hit in the desktop publishing market and helped launch Apple into a multi-billion dollar company.
Like Jobs connecting calligraphy to the computer, there are many “dots” on the investment landscape that, when connected, help draw a picture of the health of the financial markets. Here are a few “dots” to keep an eye on:
• Gold setting a new all-time record high last week, according to Financial Times
• U.S. interest rates near historical lows, according to The Wall Street Journal
• Inflation nearly non-existent in the U.S., according to MarketWatch
• The U.S. dollar near a 15-year low against the Japanese Yen, according to Bloomberg
• Trillion-dollar U.S. budget deficits, according to Bloomberg
• The U.S. unemployment rate near a 27-year high, according to MarketWatch
• The rise of the Tea Party movement, according to Barron’s
• The Federal Reserve engaging in quantitative easing, according to CNBC
Weekly Focus – Think About It
“When nothing is sure, everything is possible.” --Margaret Drabble
Best regards,
Kevin Kroskey
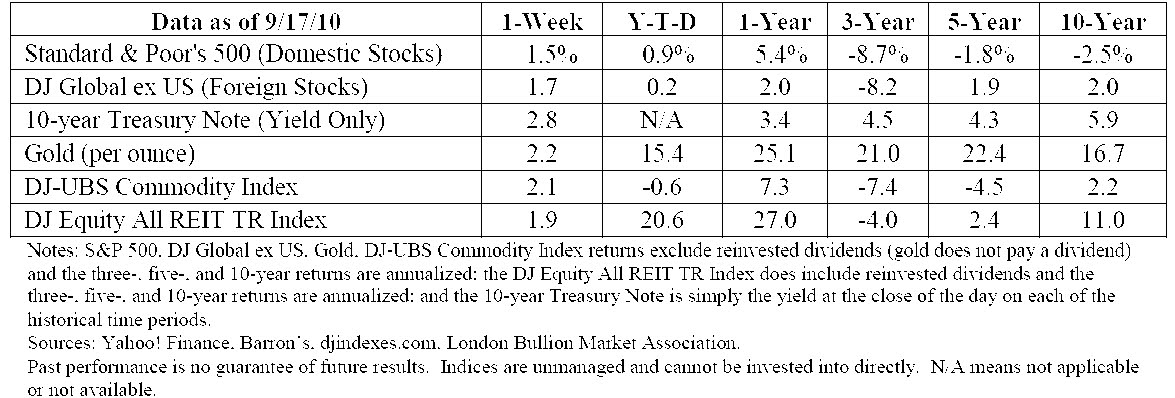
* The Standard & Poor's 500 (S&P 500) is an unmanaged group of securities considered to be representative of the stock market in general.
* The DJ Global ex US is an unmanaged group of non-U.S. securities designed to reflect the performance of the global equity securities that have readily available prices.
* The 10-year Treasury Note represents debt owed by the United States Treasury to the public. Since the U.S. Government is seen as a risk-free borrower, investors use the 10-year Treasury Note as a benchmark for the long-term bond market.
* Gold represents the London afternoon gold price fix as reported by the London Bullion Market Association.
* The DJ Commodity Index is designed to be a highly liquid and diversified benchmark for the commodity futures market. The Index is composed of futures contracts on 19 physical commodities and was launched on July 14, 1998.
* The DJ Equity All REIT TR Index measures the total return performance of the equity subcategory of the Real Estate Investment Trust (REIT) industry as calculated by Dow Jones.
* Yahoo! Finance is the source for any reference to the performance of an index between two specific periods.
* Opinions expressed are subject to change without notice and are not intended as investment advice or to predict future performance.
* Past performance does not guarantee future results.
* You cannot invest directly in an index.
* Consult your financial professional before making any investment decision.
* This newsletter was prepared by PEAK.


