THE MONTH IN BRIEF
Another month, another minor gain for stocks. The Q1 earnings season didn’t give the S&P 500 much of a lift – the index advanced 0.62% for April. Small caps were hit hard during the month. Indices in the Americas and Europe largely outperformed Asian benchmarks. COMEX gold gained in April, but NYMEX crude did not. Last month saw a major drop in new home sales, but only a fractional decrease in existing home sales. An important consumer sentiment index surged north, but a respected consumer confidence index declined. As April wrapped up, worries about a Russian takeover of Ukraine reemerged.1
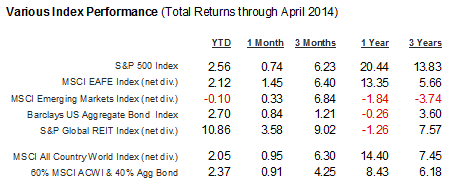
Key index performance is shown in the table below. You'll note real estate (REITs) has continued to do well after being oversold in late 2013.
 DOMESTIC ECONOMIC HEALTH
Were Americans feeling upbeat about the economy in April ... or not? It was hard to tell from the two most esteemed household surveys. The University of Michigan’s consumer sentiment index hit a 9-month peak in April, rising to 84.1 from March’s final reading of 80.0; on the other hand, the Conference Board’s survey of consumer confidence declined 1.6 points last month to 82.3.2,3
Another month, another minor gain for stocks. The Q1 earnings season didn’t give the S&P 500 much of a lift – the index advanced 0.62% for April. Small caps were hit hard during the month. Indices in the Americas and Europe largely outperformed Asian benchmarks. COMEX gold gained in April, but NYMEX crude did not. Last month saw a major drop in new home sales, but only a fractional decrease in existing home sales. An important consumer sentiment index surged north, but a respected consumer confidence index declined. As April wrapped up, worries about a Russian takeover of Ukraine reemerged.1
Key index performance is shown in the table below. You'll note real estate (REITs) has continued to do well after being oversold in late 2013.
Were Americans feeling upbeat about the economy in April ... or not? It was hard to tell from the two most esteemed household surveys. The University of Michigan’s consumer sentiment index hit a 9-month peak in April, rising to 84.1 from March’s final reading of 80.0; on the other hand, the Conference Board’s survey of consumer confidence declined 1.6 points last month to 82.3.2,3
Payrolls expanded by 288,000 new hires in April and the jobless rate fell to 6.3%. The sour note: the sharp drop in unemployment was mostly because fewer people looked for work. The U-6 rate (unemployment + underemployment) was still up at 12.3%, no doubt a troubling factoid for the Federal Reserve.4
Walking randomly up Main Street, further March indicators show a 1.1% rise in retail sales and a 0.2% increase in the Consumer Price Index. (The headline CPI was up 1.5% in a year.) Consumers spent 0.9% more in March as wages rose 0.5%.3,5
Even with that significant consumer spending boost, the economy hardly grew in Q1. In its initial estimate, the Bureau of Economic Analysis measured first quarter GDP at 0.1% – not exactly the 1.2% growth projected by analysts in a Bloomberg poll, and a far cry from the 2.6% GDP of Q4.6
The Institute for Supply Management’s factory PMI was at a healthy 53.7 in March and an even healthier 54.9 in April; by April, the factory sector had expanded for 11 straight months. ISM’s service sector PMI came in at 53.1 for March. The third month of the year saw a 2.6% pickup in durable goods orders, with the gain at 2.2% minus defense industry orders. Wholesale inflation increased, too – the 0.5% March rise in the Producer Price Index took the yearly rise in PPI up to 1.4%.3,7,8
Last but not least, the Fed announced another $10 billion cut in QE3 come May, reducing its monthly economic stimulus to $45 billion. Its April 30 statement reiterated that it would keep the main U.S. interest rate near zero for a “considerable time” after the end of its extraordinary asset purchase campaign.6
GLOBAL ECONOMIC HEALTH
Was Russia poised to take over Ukraine? Tensions heightened between the nations as April ended, with Russian separatists staging protests and taking foreign military observers hostage. In late April, the EU expanded its economic sanctions against Russia and Standard & Poor’s downgraded the nation’s debt rating to BBB- (a step above junk). NATO’s top commander, U.S. Air Force General Phillip Breedlove, reminded the press that “highly organized, highly supported forces [were] in place” if Russia wished to mount a full-scale invasion. While the ruble was down more than 7% YTD against the dollar as April ended, Russian officials spoke of a retaliatory economic response against the EU and the United States. (Since so many eurozone nations depend on energy imports from Russia, the EU has so far refrained from truly harsh sanctions against the country.)9
At least the global manufacturing picture looked a bit brighter. China’s official purchasing manager index ticked north a tenth of a percent to 50.4 in April, and last month found South Korean exports up 9% year-over-year. The United Kingdom’s Markit manufacturing PMI rose 1.5 points to 57.3 for April, while Germany’s official factory PMI advanced to 54.2. The overall euro area manufacturing PMI rose slightly to 53.3 last month.10,11
WORLD MARKETS
Major indices in the Americas went mostly green last month. April brought gains of 0.62% for the IPC All-Share, 6.40% for the Merval, 2.21% for the TSX Composite and 2.40% for the Bovespa. Asia Pacific indices were up and down – KSE 100, +6.45%; PSE Composite, +4.34%; ASX 200, +1.75%; Asia Dow, +0.52%; Sensex, +0.14; Hang Seng, -0.08%; Shanghai Composite, -0.35%; Kospi, -1.20%; Nikkei 225, -3.53%. Aside from a 5.74% drop for Russia’s RTS, key indices in Europe mostly advanced – the DAX rose 0.50%, the CAC 40 2.18%, the STOXX 600 1.07%, the FTSE 100 2.75% and the Europe Dow 0.72%.1
The Global Dow was up 0.75% for April; the MSCI Emerging Markets Index rose just 0.06%, but the MSCI World Index gained 0.83%.1,12
COMMODITIES MARKETS
COMMODITIES MARKETS
At the end of April, a barrel of oil was worth $99.74 on the NYMEX, an ounce of gold $1,295.90 on the COMEX. Commodity performance was mixed for the month, with some of the biggest gains unsurprisingly coming in crops.13
Coffee was out front in April, with futures rising 16.48%. Cotton gained 1.28%, soybeans 4.62%, cocoa 1.22%, and corn 2.34%; sugar fell 4.59% for the month. Thoughts of possible interruption of natural gas supplies in Europe sent those futures 9.73% higher in April; unleaded gasoline futures also rose 1.57%. Heating oil futures retreated 0.19% in April, and oil futures pulled back 1.79%.13
Copper (-0.71%) and silver (-3.34%) did not advance in April, but gold (+0.67%) and platinum (+0.76%) did. The U.S. Dollar Index lost 0.75% in April and settled at 79.47 to end the month.13,14
REAL ESTATE
Was the housing market stalling out? Or just having a seasonal slump? The March home sales numbers certainly paled in comparison to a year ago, with reduced inventory and higher interest rates exerting their influence. The Census Bureau reported a 14.5% drop in new home purchases; the National Association of Realtors announced a mere 0.2% dip in resales. A bright spot surfaced: NAR also measured a 3.4% gain in pending home sales, the first increase since June. 3
As for home prices, the annual increase recorded by the S&P/Case-Shiller index decreased to 12.9% in the February edition from the previous 13.2%. On a monthly basis, the Case-Shiller was flat. NAR recorded a median existing home sales price of $198,500 in March, up 7.9% year-over-year. On the construction front, a 2.8% March boost in housing starts was offset by a 2.4% fall for building permits.3,15
In Freddie Mac’s March 27 Primary Mortgage Market Survey, average interest rates for various home loans were as follows: 30-year FRMs, 4.40%; 15-year FRMs, 3.42%; 5/1-year ARMs, 3.10%; 1-year ARMs, 2.44%. On May 1, most of those numbers were lower, with average rates on 30-year FRMs at 4.29%, 15-year FRMs at 3.38%, 5/1-year ARMs at 3.05%, and 1-year ARMs at 2.45%.16
LOOKING BACK…LOOKING FORWARD
The Dow wrapped up April with a fresh record close of 16,580.84 and the S&P 500 ended the month near its all-time peak at 1,883.95. The Nasdaq concluded April at 4,114.56. A 3.94% April descent left the Russell 2000 at -3.16% YTD. The CBOE VIX fell 3.39% last month to end April at -2.26% YTD.1
As the trading day ended April 30, 310 S&P 500 member firms had announced quarterly results, with 75% of them exceeding profit forecasts and 52% of them beating sales projections. Analysts tracking profits for Bloomberg estimated that profits for S&P 500 companies improved 3.4% in the first quarter.6
There definitely seems to a sentiment that the U.S. economy is growing stronger and stronger, and improving jobs data and a spring pickup in home sales would add to that perception. The key question is are the market expectations for the U.S. economy and stock prices above what will be the realized level. If so, that doesn't bode well for U.S. stock prices.
To Your Prosperity,
Kevin Kroskey, CFP®, MBA
This article adapted with permission from MarketingLibrary.net, Inc.
Citations.
1 - online.wsj.com/mdc/public/page/2_3023-monthly_gblstkidx.html
[4/30/14] 2 - tinyurl.com/n2hh8eh [4/25/14]
3 - investing.com/economic-calendar/ [4/30/14]
4 - blogs.wsj.com/economics/2014/05/02/highlights-from-the-april-jobs-report/ [5/2/14]
5 - briefing.com/investor/calendars/economic/2014/04/28-02 [5/1/14]
6 - bloomberg.com/news/2014-04-30/u-s-stock-index-futures-fall-on-twitter-ebay-earnings.html [4/30/14]
7 - ism.ws/ISMReport/NonMfgROB.cfm [4/3/14]
8 - ism.ws/ISMReport/MfgROB.cfm [5/1/14]
9 - businessweek.com/news/2014-04-28/u-dot-s-dot-aims-at-putin-s-inner-circle-with-latest-round-of-sanctions [4/28/14]
10 - ft.com/cms/s/0/41fe3f6c-d112-11e3-9f90-00144feabdc0.html [5/1/14]
11 - tinyurl.com/lh35sh7 [4/23/14]
12 - mscibarra.com/products/indices/international_equity_indices/gimi/stdindex/performance.html [4/30/14]
13 - money.cnn.com/data/commodities/ [4/30/14]
14 - online.wsj.com/mdc/public/npage/2_3050.html?mod=mdc_curr_dtabnk&symb=DXY [5/1/14]
15 - realtor.org/news-releases/2014/04/existing-home-sales-remain-soft-in-march [4/22/14]
16 - freddiemac.com/pmms/pmms_archives.html [5/1/14]
17 - bigcharts.marketwatch.com/historical/default.asp?symb=DJIA&closeDate=4%2F1%2F13&x=0&y=0 [4/30/14]
17 - bigcharts.marketwatch.com/historical/default.asp?symb=COMP&closeDate=4%2F1%2F13&x=0&y=0 [4/30/14]
17 - bigcharts.marketwatch.com/historical/default.asp?symb=SPX&closeDate=4%2F30%2F13&x=0&y=0 [4/30/14]
17 - bigcharts.marketwatch.com/historical/default.asp?symb=DJIA&closeDate=3%2F31%2F04&x=0&y=0 [4/30/14]
17 - bigcharts.marketwatch.com/historical/default.asp?symb=COMP&closeDate=3%2F31%2F04&x=0&y=0 [4/30/14]
17 - bigcharts.marketwatch.com/historical/default.asp?symb=SPX&closeDate=4%2F30%2F04&x=0&y=0 [4/30/14]
18 - treasury.gov/resource-center/data-chart-center/interest-rates/Pages/TextView.aspx?data=realyieldAll [5/1/14]


