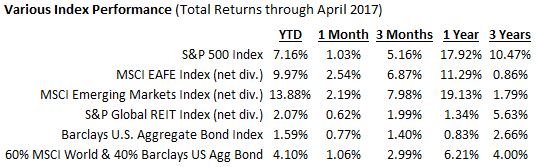
The month of April yielded positive returns for all major indices with international stock markets leading on the heels of the boost from the French elections. Emerging Markets are the best performing asset class now up 13.88% for 2017. A 60% stock and 40% bond balanced portfolio is up 4.10%.
April’s Economic Highlights
- Employment: The employment report for March showed job hirings slowed to 98,000 following gains of 219,000 in February and 216,000 in January, revised. Average hourly earnings increased by $0.05 to $26.14, following a $0.06 increase in February. Over the last 12 months ended in March, average hourly earnings have risen by $0.68, or 2.7%.
- Interest rates: The Federal Open Market Committee did not meet in April, but is scheduled to meet during the first week of May. While the FOMC anticipated raising interest rates three times during 2017, some members of the Committee will want to see solid economic growth before voting to increase rates at the next FOMC meeting in May. [Update: on 5/3/2017, After its two-day policy meeting, the Federal Open Market Committee unanimously voted to hold the federal funds rate between 0.75% and 1.00%, citing slowing economic growth.}
- GDP: Expansion of the U.S. economy slowed over the first three months of 2017. According to the Bureau of Economic Analysis, the first-quarter 2017 gross domestic product grew at an annualized rate of 0.7% compared to the fourth-quarter 2016 GDP, which grew at an annual rate of 2.1%.
- Inflation: Consumer prices also retreated in March, slipping 0.3% from February. For the year, consumer prices are up 2.4%. Core prices, which exclude food and energy, dropped 0.1% for the month and have increased 2.0% since March 2016.
- International markets: In France, the rise of Emmanuel Macron, a former investment banker, as the heavy favorite to win the May 7 presidential race sent stocks and the euro higher, as the eurozone continues to gain its economic footing following the financial crisis of 2008. Greece reached a budget surplus that's eight times higher than the 0.5% primary target set by its creditors. This bodes well for continued bailout support for the financially embattled country.
As always: stay disciplined, focus on those things you can control, and ignore the rest.
To Your Prosperity,
Kevin Kroskey, CFP®, MBA
Data sources: Economic: Based on data from
U.S. Bureau of Labor Statistics (unemployment, inflation); U.S. Department of
Commerce (GDP, corporate profits, retail sales, housing); S&P/Case-Shiller
20-City Composite Index (home prices); Institute for Supply Management
(manufacturing/services). Performance: Based on data reported in WSJ Market
Data Center (indexes); U.S. Treasury (Treasury yields); U.S. Energy Information
Administration/Bloomberg.com Market Data (oil spot price, WTI Cushing, OK);
www.goldprice.org (spot gold/silver); Oanda/FX Street (currency exchange
rates). News items are based on reports from multiple commonly available
international news sources (i.e. wire services) and are independently verified
when necessary with secondary sources such as government agencies, corporate
press releases, or trade organizations. All information is based on sources
deemed reliable, but no warranty or guarantee is made as to its accuracy or
completeness. Neither the information nor any opinion expressed herein
constitutes a solicitation for the purchase or sale of any securities, and
should not be relied on as financial advice. Past performance is no guarantee
of future results. All investing involves risk, including the potential loss of
principal, and there can be no guarantee that any investing strategy will be
successful.
The Dow Jones Industrial Average (DJIA) is a
price-weighted index composed of 30 widely traded blue-chip U.S. common stocks.
The S&P 500 is a market-cap weighted index composed of the common stocks of
500 leading companies in leading industries of the U.S. economy. The NASDAQ
Composite Index is a market-value weighted index of all common stocks listed on
the NASDAQ stock exchange. The Russell 2000 is a market-cap weighted index
composed of 2,000 U.S. small-cap common stocks. The Global Dow is an equally weighted
index of 150 widely traded blue-chip common stocks worldwide. The U.S. Dollar
Index is a geometrically weighted index of the value of the U.S. dollar
relative to six foreign currencies. Market indices listed are unmanaged and are
not available for direct investment.


